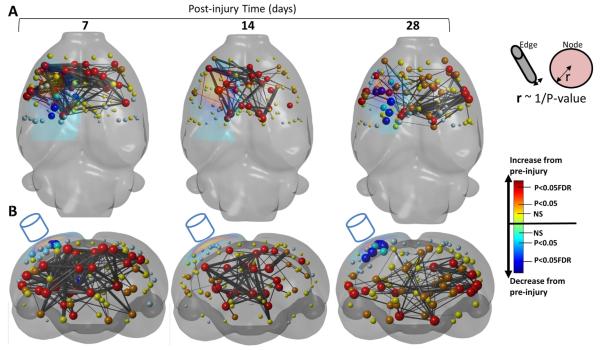
Fig. 6.
Increase in functional connectivity. [A] Axial and [B] coronal, 3-dimensional-rendered statistical difference plots of node and increased in edge strength at 7, 14 and 28 days after injury compared to pre-injured showing the brain regions of significant increase in connectivity (edge strength, black/gray bars, q = 0.005 FDR corrected) that occur almost exclusively in regions of low nodal connectedness (node strength data is repeated here from Fig. 4). The greatest increase in connectivity occurred at 7 days after injury over wide areas of the brain. Increased connectivity persisted until 14 and 28 days where enhanced connections were largely subcortical and contra-lesional cortex. Key — see Fig. 3.

