
Fig. 2.
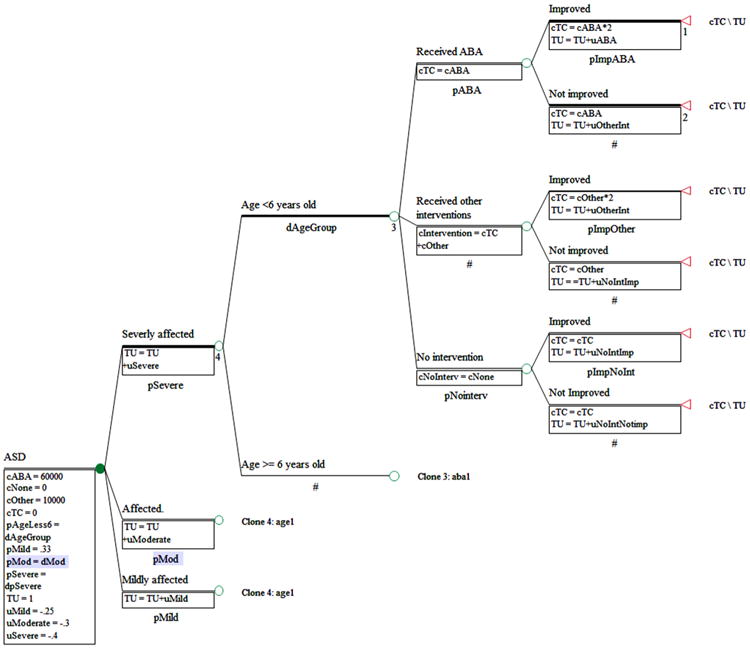
Example of a decision tree diagram for cost-effectiveness analysis of early interventions. ABA applied behavioral analysis, ASD autism spectrum disorder, cABA cost of ABA, cNoInterv cost of no intervention, cNone cost of no intervention, cOther costs of other interventions, cTC Total cost, pABA probability of receiving ABA, pAgeLess6 probability of being in the group of age <6 years old, pMild probability of having mild ASD, pMod probability of having mmoderate ASD, pNointerv probability of receiving no intervention, pSevere probability of having severe ASD, TU total health utility, uMild health utility of mild ASD, uABA health utility related to receiving ABA, uModerate health utility of moderate ASD, uNoIntImp health utility related to receiving no intervention and no improvement, uOtherInt health utility related to receiving other interventions, uSevere health utility of severe ASD