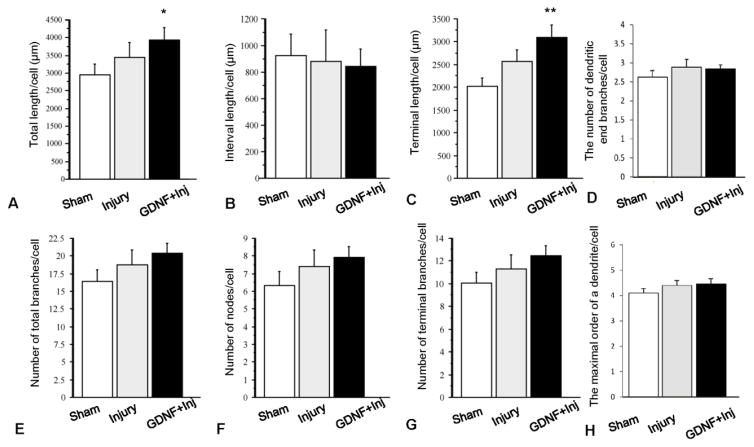
Figure 4.
Comparison of the dendritic features of the 36 GFP-labeled and fully reconstructed dPSN neurons from sham (n=15), transection injury (TX, n=10) and TX + GDNF treatment groups (n=11). (A) total dendritic length; (B) dendritic interval length; (C) terminal dendritic length; (D) number of dendritic end branches/cell; (E) number of total dendritic branches; (F) number of dendritic nodes; (G) number of terminal dendritic branches; and (H) maximal order of dendritic branches. *: p < 0.05; **: p < 0.01, Compared to sham group. Bar heights represent means ± SD.

