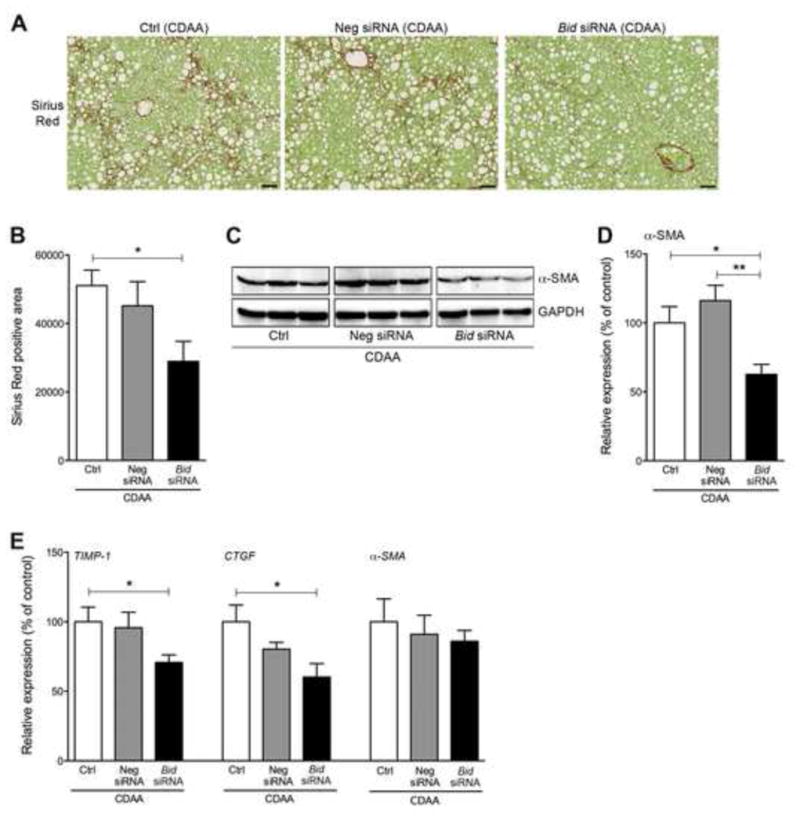
Fig. 3. Bid siRNA treatment reversed NASH fibrosis through a reduction in HSC activation.

(A) Sirius Red staining of liver sections in mice fed a CDAA diet administered with control, Neg siRNA, or Bid siRNA. Scale bar, 250 μm. (B) Bar graph shows quantification of Sirius Red positive area from liver sections. * p<0.05. (C) Protein expression of a-SMA in whole liver using immunoblotting. (D) Bar graph shows quantification of positive area of Sirius Red from liver sections stained with Sirius Red. **p<0.01, * p<0.05. (E) Gene expression of fibrogenic genes as measured by qPCR. All gene expression levels were normalized to housekeeping control, β2 microglobulin, and shown relative to the expression levels of mice fed a CDAA diet treated with control. * p<0.05. Values are mean ± SEM. Ctrl: Control, Neg siRNA: negative siRNA
