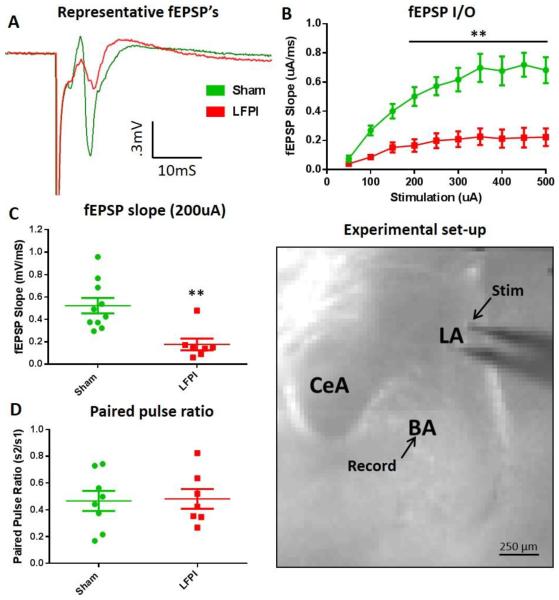
Fig. 2. LFPI decreases lateral amygdala evoked basolateral amygdala fEPSP's.
(A) Representative fEPSP recordings from brain slices of sham (green) and LFPI (red) animals (200 μA stimulation intensity). (B) Average fEPSP slope input-output (I/O) curve (50-500 μA, 50 μA steps, stimulation). LFPI causes a significant decrease in the BLA I/O curve (sham n=16 slices / 10 animals, LFPI n=14 slices / 7animals, P <0.001***). Black line denotes repeated measures that are significantly different in post hoc comparisons. (C) Distribution of fEPSP slopes recorded simultaneously with VSD imaging experiments (200 μA stimulation). LFPI causes a significant decrease in the BLA fEPSP slope (sham n=17 slices / 10 animals, LFPI n=14 slices / 7animals, P <0.002**). (D) BLA fEPSP amplitude paired pulse ratio (200 μA stimulation, 70 ms inter stimulus interval). LFPI has no effect on BLA fEPSP paired puse ratio (sham n=14 slices / 8animals, LFPI n=12 slices / 7 animals, P= 0.999). (Experimental set-up) Representative brain slice showing amygdala subregions and electrode placements. “Stim” and “Record” arrows show placement of tip of stimulation and recording electrodes.

