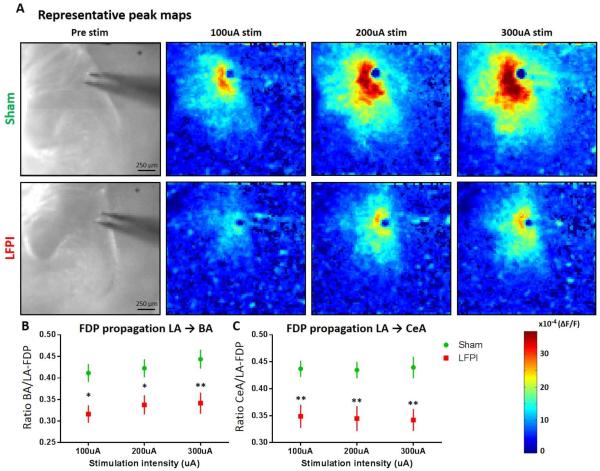
Fig. 5. Amygdala VSD peak maps and regional activation ratios showing decreased propagation in amygdala circuit following LFPI.
(A) Representative peak maps showing the maximum ΔF/F recorded at each spatial site at any time point, for brain slices from sham and LFPI animals. From left to right: slice image showing amygdala anatomy followed by peak response to 100, 200, and 300 μA stimulation intensities. (B) LA-to-BA activation ratio. BA FDP amplitude/LA FDP amplitude reveals a significant decrease in propagation of activation in LFPI animals (sham n= 16 slices / 9 animals, LFPI n=14 slices / 7 animals, P= 0.005**). (C) LA-to-CeA activation ratio. CeA FDP amplitude/LA FDP amplitude reveals a significant decrease in propagation of activation from lateral to central amygdala in LFPI animals (sham n= 16 slices / 9 animals, LFPI n=14 slices / 7 animals, P= 0.003**).

