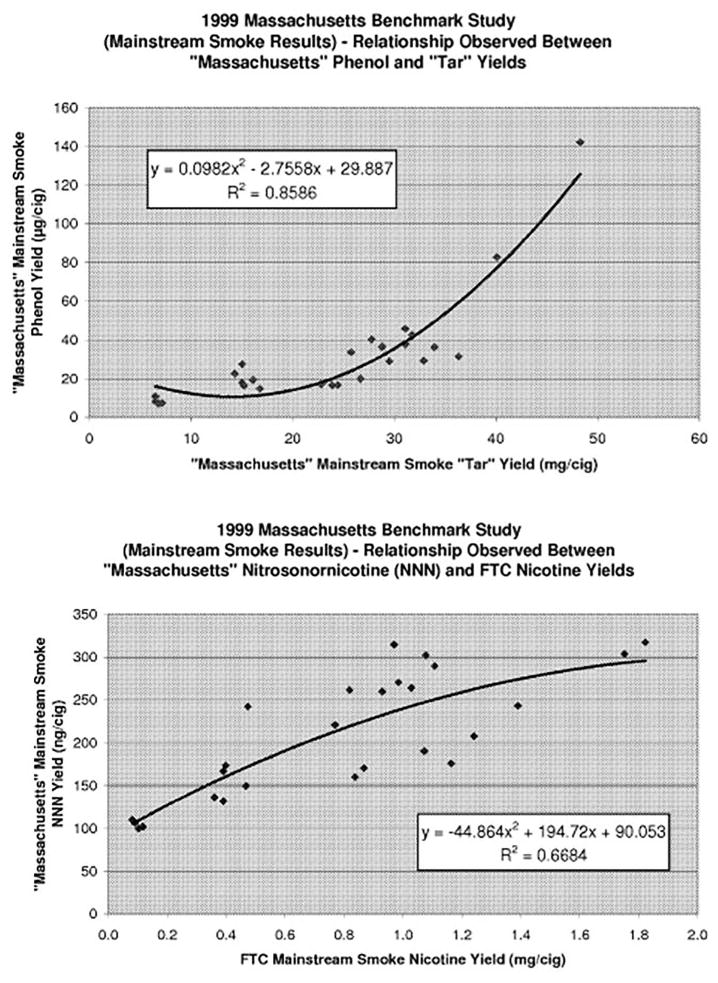
Figure 2.
Regression equations from the MBS did not provide accurate predictions for the level of constituents based on tar or nicotine.9 In tar ranges of 5–25 mg/cig the predicted values for phenol ranged by up to 300% despite a relatively flat best fit line (top). There is wide variation in actual NNN from those predicted by FTC nicotine yields (bottom).9 FTC, Federal Trade Commission; MBS, Massachusetts Benchmark Study.

