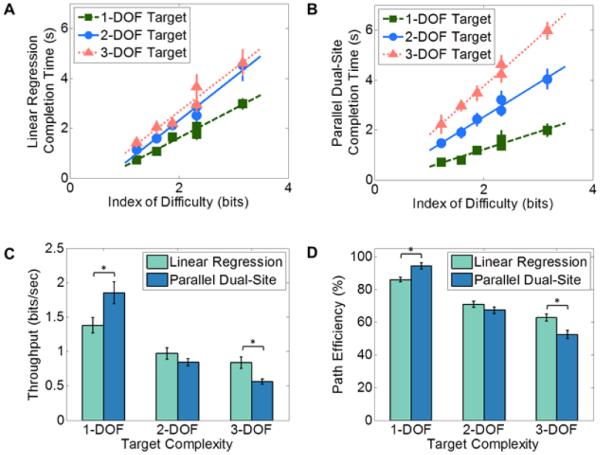
Figure 3.

Fitts’ law performance. (A-B): Empirical Fitts’ law regression models, relationship between completion time and index of difficulty for the two control systems. (A) For linear regression control, R2 was 0.97, 0.97, and 0.95 for 1-, 2-, and 3-DOF targets, respectively. (B) For parallel dual-site control, R2 was 0.94, 0.97, and 0.99 for 1-, 2-, and 3-DOF targets, respectively. (C-D): Fitts’ law performance metrics for the two control systems. Subjects exhibited higher values of throughput (C) and path efficiency (D) with linear regression control during 3-DOF targets, but lower values for 1-DOF targets. * p < 0.05
