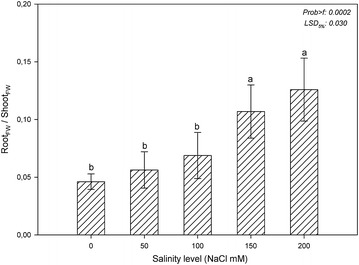
Fig. 1.

Root-shoot ratio based on the fresh weights of marigold under salinity stress. The vertical bars indicate standard deviations, and different letters indicate statistically significant differences at P ≤ 0.05 (least significant difference test)
