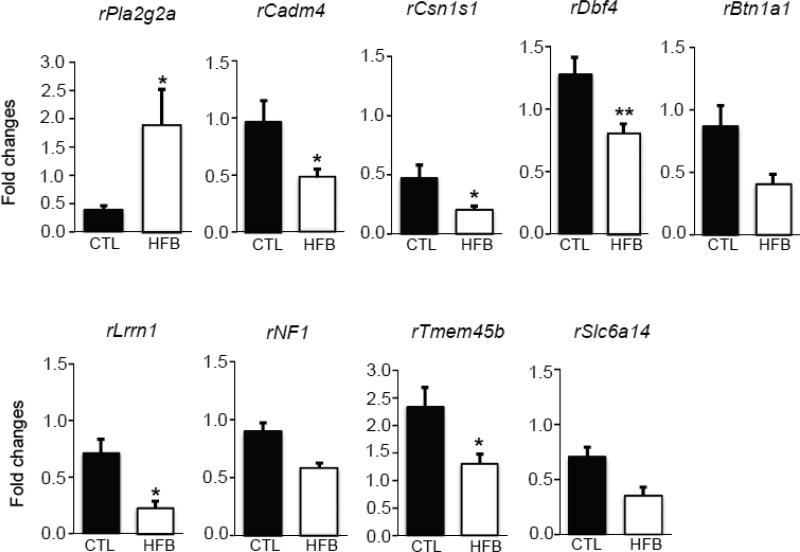
Fig. 3.
Real-time PCR analyses of differentially expressed genes in this study. RNA sequencing shows transcripts levels of 9 genes. Relative levels of transcript expression of rPla2g2a (upregulated), rCadm4, rCsn1s1, rDbf4, rLrrn1, rBtn1a1, rNf1, rTmem45b, and rSlc6a14 (downregulated) in day 21 rat mammary gland of HFBUTTER (HFB) groups (n=5) compared with control (CTL) (n=5). Comparison with CTL used Student's t-test. p<0.05 compared with control.

