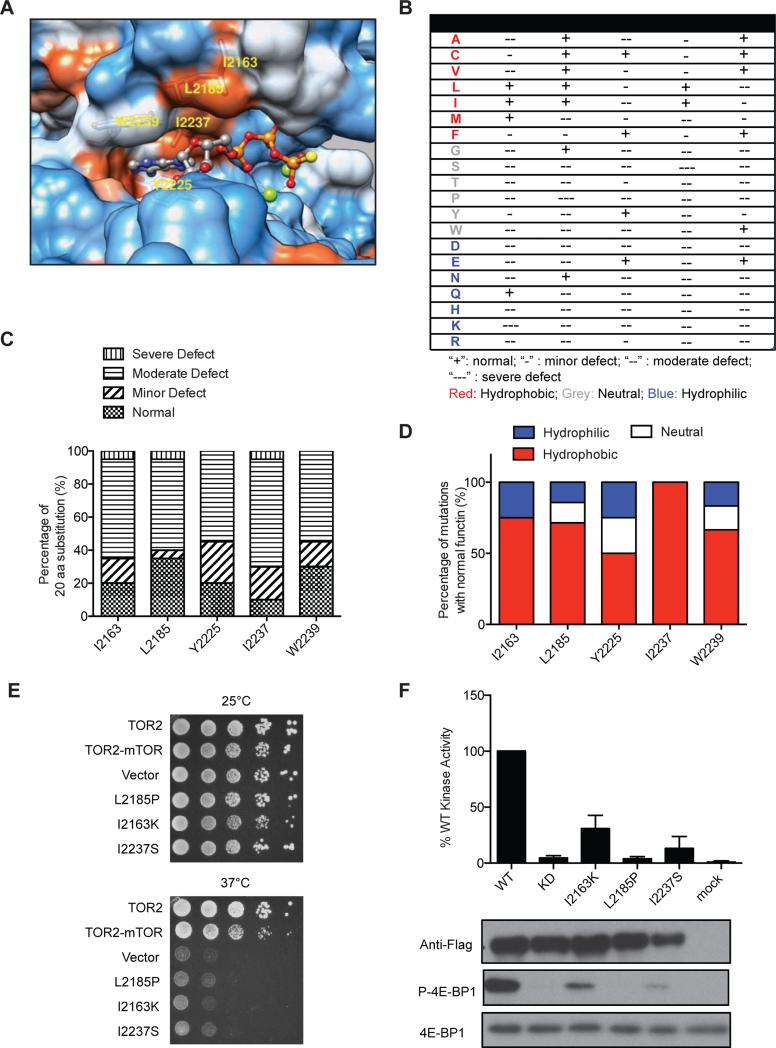
Figure 7. Saturation mutagenesis of highly conserved hydrophobic residues of mTOR kinase domain.
(A) Shown is hydrophobic surface representation of the ATP-binding pocket of mTOR kinase bound with an ATP molecule (PDB ID code 4JSP). ATP atoms are colored as follows: N, blue; O, red; P, orange; S, yellow; Mg+2, green. Protein surface representation is as follows: hydrophobic residue, red; neutral residue, white; hydrophilic residue, blue.
(B) Summary of the effect of mutations at different conserved hydrophobic residues in mTOR kinase domain. “+”: normal; “−”: minor defect; “−−”: moderate defect; “−−−”: severe defect.
(C) Stacked bar graph summarizes each category of mutations in terms of function as a percentage of total mutations.
(D) Stacked bar graph summarizing hydrophobic, neutral, and hydrophilic mutations as a percentage of total mutations with normal mTOR kinase function.
(E) Shown is yeast growth-based assay for several representative mutations with severe loss-of-function in mTOR kinase.
(F) WT and mutant Flag-mTOR were transiently expressed in HEK293T cells, immunoprecipitated, and assayed for mTOR kinase activity toward recombinant 4E-BP1 in vitro. Phosphorylation of 4E-BP1 was analyzed by immunoblot using a P-4E-BP1 specific antibody. Data represent means ± SD in three independent experiments.

