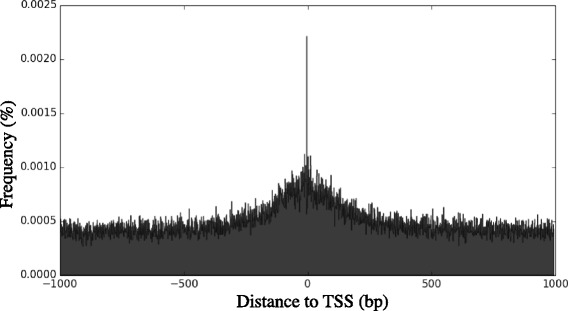
Fig. 2.

Distribution of the TYAYWWW motif around transcription initiation sites. The horizontal axis represents sequence areas from -1,000 bp to +1,000 bp around transcription initiation sites with single nucleotide resolution. Position 0 represents the transcription initiation site, with a peak observed at the -3 position. The vertical axis represents the normalized frequency of the motif
