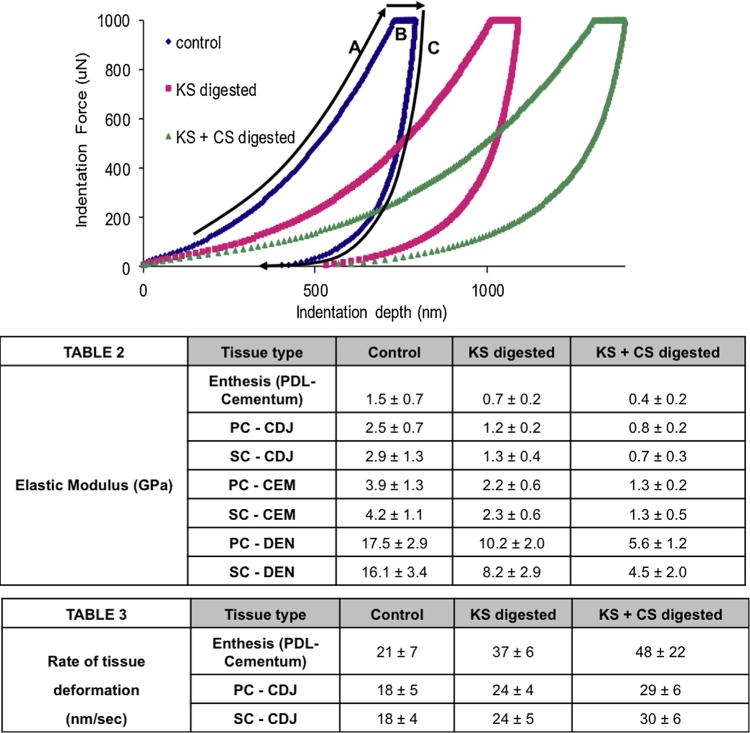
Fig. 6.

Load-hold-unload segments of the curve for site-specific mechanical testing are shown; loaded to a peak load of 1000 μN—A, 3 s hold of 1000 μN—B, and 3 s unload back to 0 μN—C. Average reduced elastic modulus (Table 2) and the rate of tissue deformation (Table 3) (loss in tissue resilience) results were calculated. Each sequential digestion yielded significant changes in mechanical behavior within the examined tissue type. A subtle variation between PC and SC locations was noted during the predigestion time point and vanished upon KS and CS digestions.
