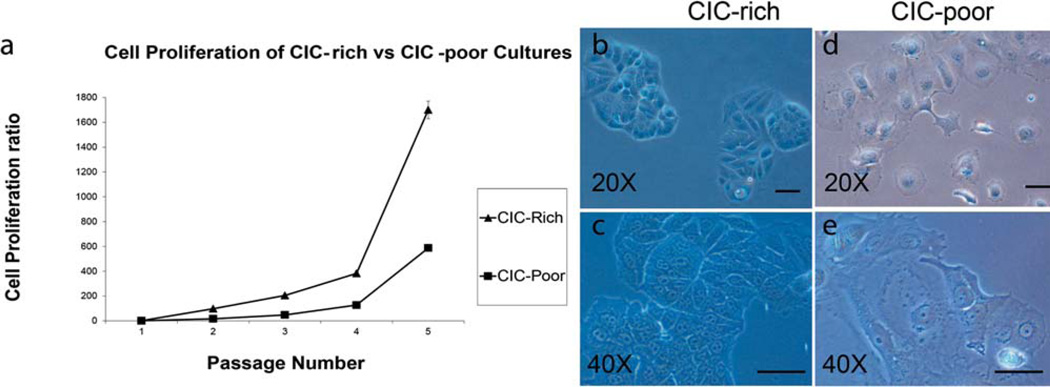
Figure 3.
CICs exhibit different morphology and proliferation properties compared to non-CICs. (a) A graph comparing the rate of proliferation of CIC-rich (triangle) with that of CIC-poor cultures (square). The isolated CICs and non-CICs were sub-cultured and counted over five passages. Light micrographs of CICs and non-CICs in culture, 7 days after isolation show that CICs form colonies with more 3D appearance shown at 20× and 40× magnification (b, c) while the non-CICs are more spread out and well attached to the substratum (d, e). Scale bar: 20 µm.

