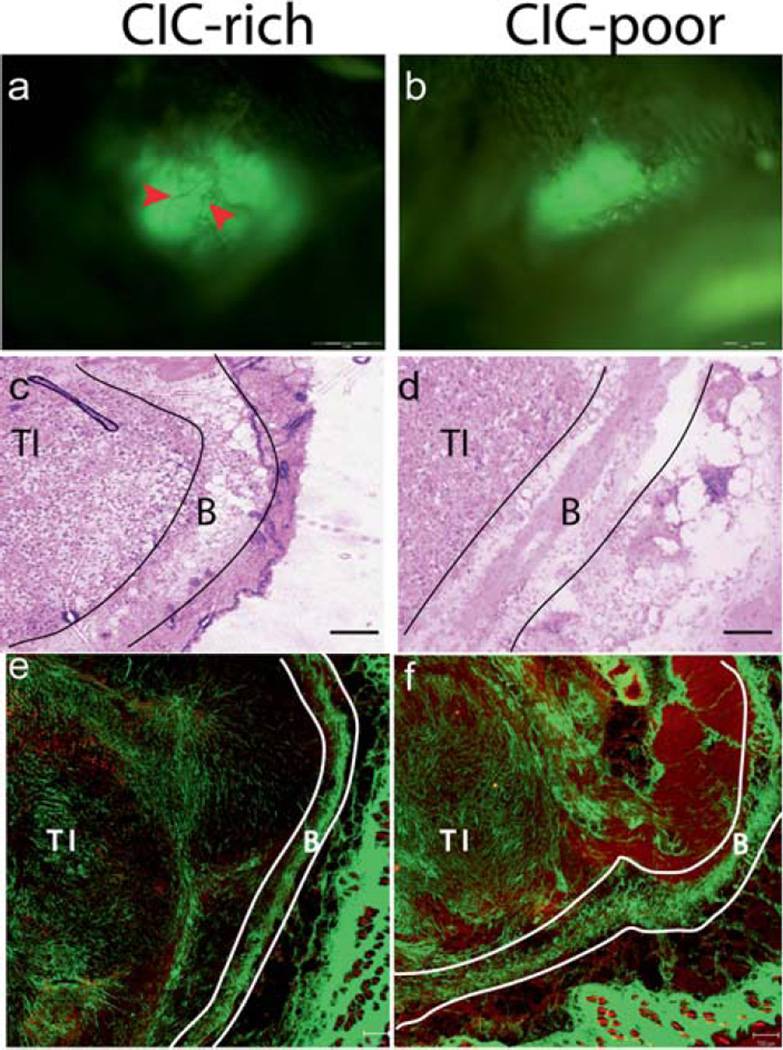
Figure 5.
CICs are more tumorigenic in SCID mice models compared to non-CICs. Whole animal imaging system imaging the GFP labelled MX-1 tumors in vivo. After 8 weeks, visible tumors were observed in all animals injected with CICs (a), and only one animal injected with non-CICs formed a tumor (b). The CIC-rich tumors were bigger than the CIC-poor tumor. Blood vessels were visualised in the CIC-rich tumor (red arrows) but not in the CIC-poor tumor. The H&E images of CIC-rich (c) and CIC-poor (d) tumors were acquired using a light microscope with a 10X objective. The SHG images of CIC-rich (e) and CIC-poor (f) tumors are tile scan images where several images taken with 10X objective are digitally stitched together. The red channel depicts the cells and the green channel the collagen. The tumor interior (TI), area beneath the boundary (AB) and tumor boundary (TB) are shown for the CIC-rich and CIC-poor tumors. Scale bar: 1 mm in (a) and (b), 50 µm in (c) and (d) 200 µm in (e) and (f).

