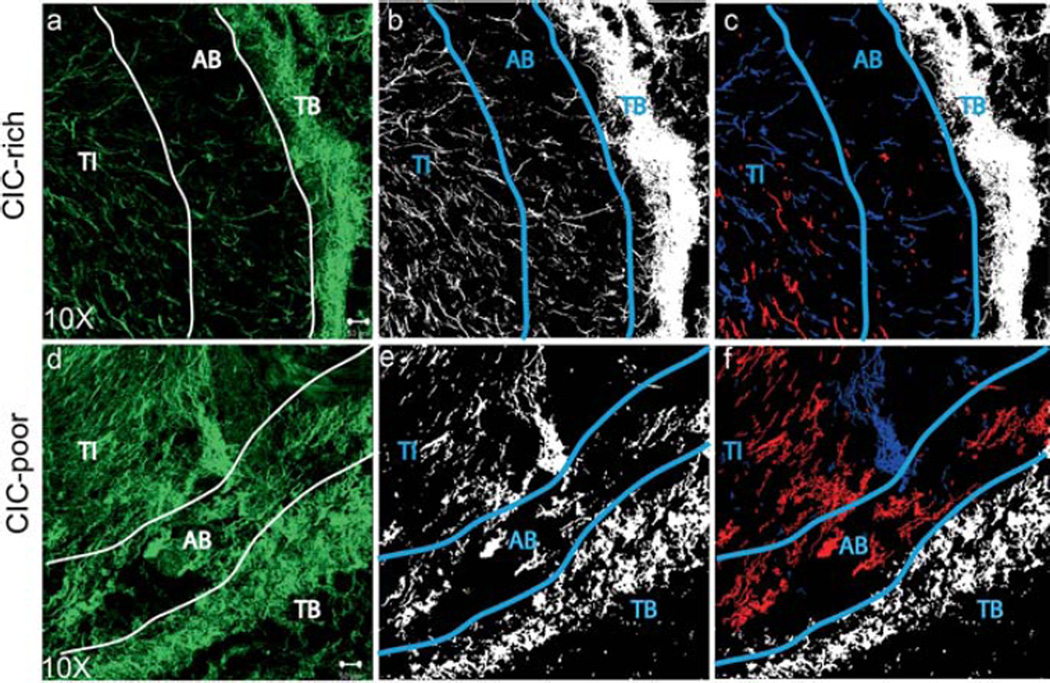
Figure 6.
CIC-rich tumors remodel the collagen matrix more than CIC-poor tumors. Second Harmonic Generation (SHG) image stacks were acquired of the 40 µm thick sample and the projections of the green channel were reconstructed to show collagen structure in the tumor (a, d). The tumor interior (TI), area beneath the boundary (AB) and tumor boundary (TB) are shown. The collagen information was segmented and the pixels identified as collagen were given the value of 1 (white) and the pixels identified as background were given the value of 0 (black) (b, e). The collagen fibers in the AB region that are aligned at an angle lesser than 30° are pseudo-colored red, while those that are aligned at an angle greater than 60° are pseudo-colored blue (c, f). Scale bar: 50 µm.

