Figure 7.
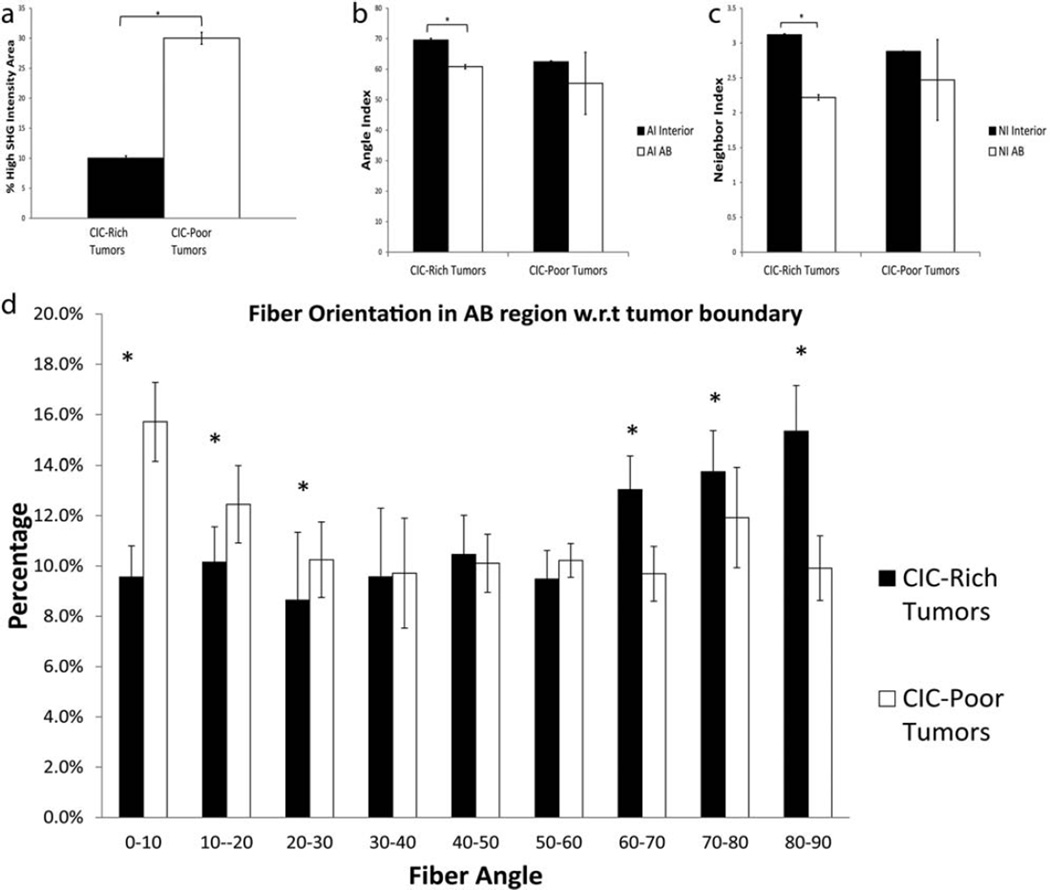
Collagen fibers in CIC-rich tumors are aligned perpendicular to the boundary. (a) Percentage of high SHG intensity area of CIC-rich (black bar) and CIC-poor tumors (white bar) was quantified as the ratio of the total collagen pixels in the tumor interior to the background. Angle Index (b) and Neighbor Index (c) of collagen fibers in the tumor interior (black bar) and the AB region (white bar) was quantified and compared for CIC-rich and CIC-poor tumors. The interior fiber orientation is significantly different from the AB region fiber orientation in CIC-rich tumors. The fiber orientation in the AB region with respect to the tumor boundary is shown in panel (d). The CIC-rich tumors (black bars) had significantly higher percentage of fibers oriented perpendicular to the tumor boundary, while the CIC-poor tumors (white bars) had significantly higher percentage of fibers oriented parallel to the tumor boundary. * indicate p < 0.05.

