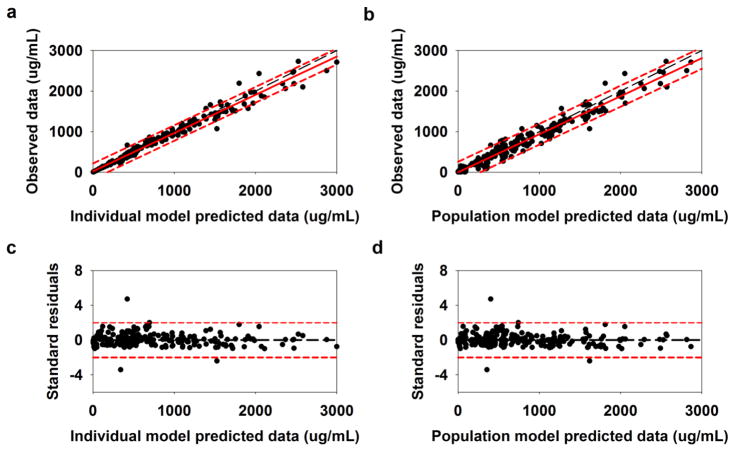
Fig. 4.
Model diagnostic plots for GHB blood concentrations: (a) observed vs. individual predicted data, (b) observed vs. population predicted data, (c) standard residuals vs. individual predicted data, and (d) standard residuals vs. population predicted data. In parts, a and b, the long-dashed line in black is the unity line, the solid line in red is the regression line, and the short-dashed lines in red are the 95% prediction intervals of the regression line. In parts c and d, the long-dashed line in black is the unity line and short-dashed lines in red are the 95% confidence intervals of the standard residuals

