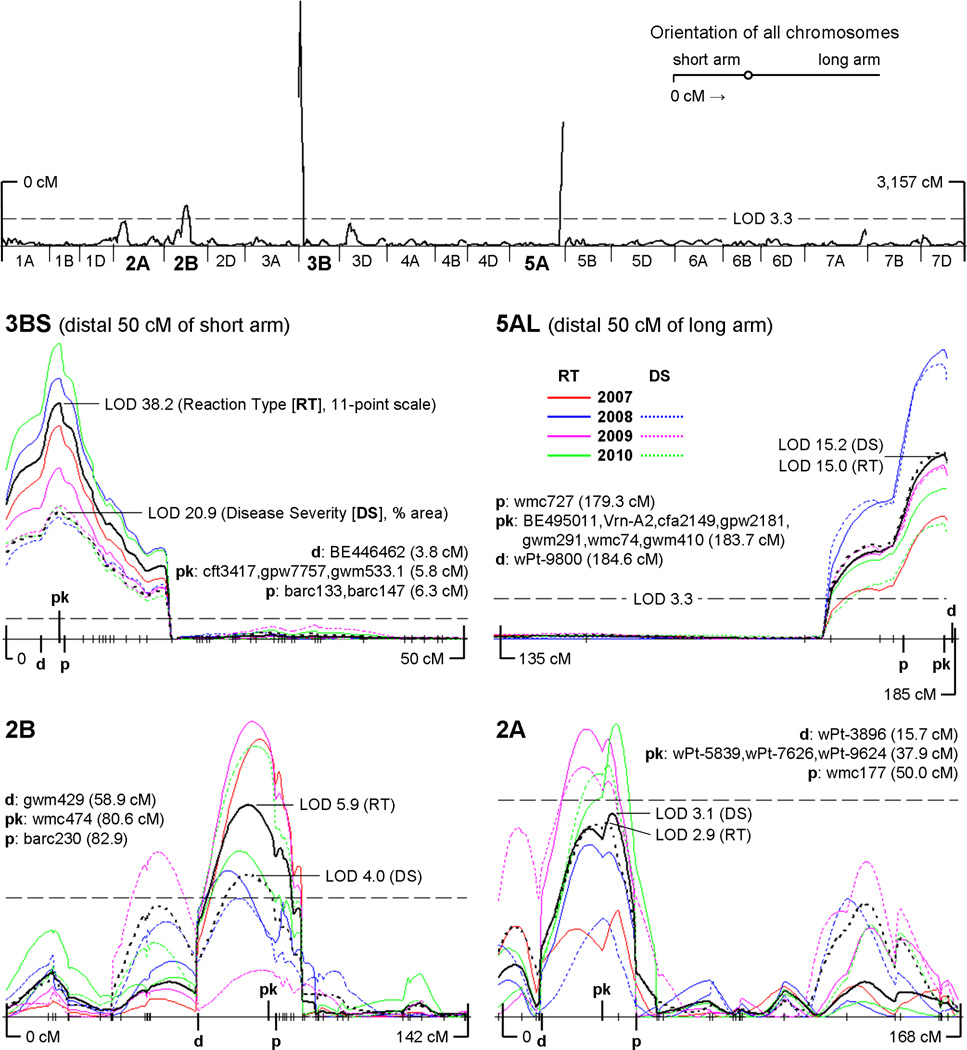
Fig. 1.
The top graph presents a whole-genome view of the results of the CIM analysis (global average of all LOD scores across all seasons and both phenotypic scales) with the threshold LOD of 3.3 indicated by a dashed horizontal line. All chromosomes in this whole-genome view are to scale and oriented with the telomere of the short arm to the left. As throughout this paper, distances are in Kosambi cM, with the telomere of the short arm positioned at 0 cM. Below is a panel of four LOD plots, one for each significant QTL region, with the threshold LOD of 3.3 included in each for scale. Within each plot, solid color lines indicate the CIM results for reaction type for each season (2007–2010, see color key in figure); dashed color lines indicate the CIM results for disease severity for each season (2008–2010). The solid black line is the average LOD plot of the four seasons of 11-point reaction type data. The dashed black line is the average LOD plot of three seasons of % disease severity data. “pk” = QTL peak marker (i.e. the locus associated with the highest overall average LOD score); “d” = distal flanking marker; “p” = proximal flanking marker. Hatch marks along the x-axes indicate the positions of mapped loci (see complete genetic map in Online Resource 2)

