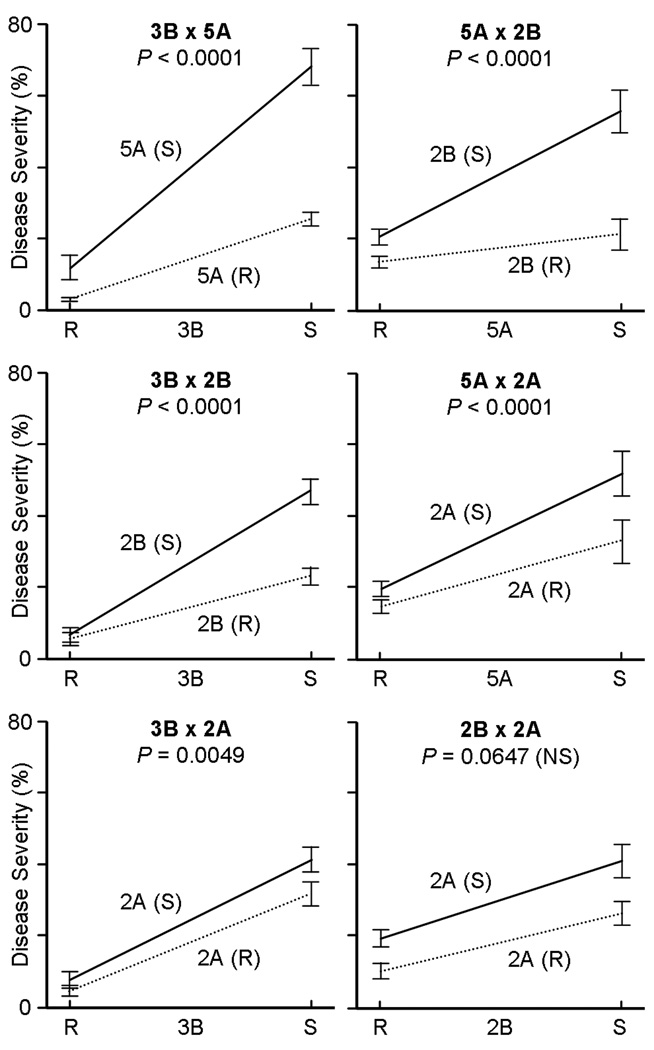
Fig. 2.
Two-way interaction plots for the four detected QTL. In each plot, the QTL region of larger magnitude is shown on the x-axis (“R” = resistant; “S” = susceptible). The two phases of the smaller QTL are indicated by the two lines in each plot (“R” = dotted line; “S” = solid line). Error bars are ± 2 standard errors, and associated p-values are indicated

