
Fig. 3.
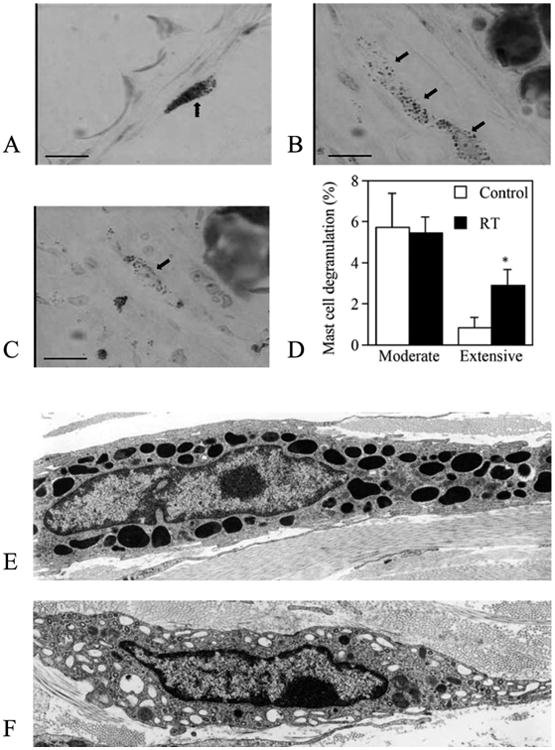
Normal mast cells in control C3H mice (panel A) and moderately (panel B) and extensively (panel C) degranulated mast cells (arrows) in the ear skin of C3H mice at 24 h after 15 Gy irradiation (bar, 20 μm; 630× original magnification). Panel D: Quantification of mast cell degranulation based on Giemsa staining. Fractions of moderately and extensively degranulated mast cells are shown. n = 3 per group; *P < 0.05 vs. nonirradiated control. Panels E and F: Electron microscopy (3,000×) of a normal mast cell with its granules (panel E) and a degranulated mast cell with some empty vacuoles and granules with decreased density (panel F).