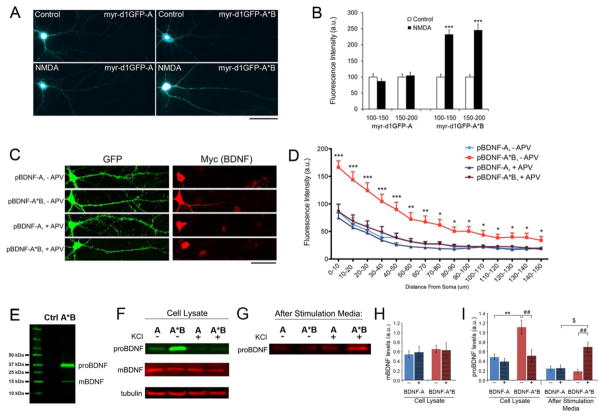
Figure 2. Activity-dependent translation of Bdnf mRNA and release of proBDNF.
(A) Representative whole cell images of cultured rat hippocampal neurons expressing either myr-d1GFP-A or myr-d1GFP-A*B. Neurons were transfected at DIV14 and treated with either vehicle (control) or 50 μm NMDA (NMDA) at DIV15 for one hour and then fixed for analysis. Scale bar, 50 μm.
(B) Quantification of myr-d1GFP fluorescence in dendrites. Fluorescence intensities on distal dendrites (100–150 μm and 150–200 μm away from somata) were measured and normalized to control levels (n=22–25).
(C) Representative whole cell images of cultured rat hippocampal neurons transfected at DIV7 with pActin-GFP and either pBDNF-A or pBDNF-A*B, and treated with either vehicle (− APV) or 50 μm APV (+ APV) from DIV26 to 28. Scale bar, 50 μm.
(D) Quantification of Myc immunoreactivity as an indicator of BDNF levels in dendrites (n=23–29).
(E) Immunoblot analysis of Myc-tagged BDNF in cell lysates from neurons infected with AAV-BDNF-A*B. The Myc tag is at the C-terminus of BDNF. The lysate of un-transduced neurons was used as a negative control (Ctrl).
(F and G) Western blot analysis of Myc-tagged BDNF in cell lysates or media from DIV35 neurons infected with either AAV-BDNF-A (A) or AAV-BDNF-A*B (A*B), that were either unstimulated (−) or stimulated with 50 mM KCl (+) for 30 minutes at 37°C.
(H and I) Quantification of mBDNF and proBDNF levels from Western blots represented in F and G (n=8 for cell lysate and n=3 for after-stimulation media).
Data are reported as mean ± SEM. ANOVA with post-hoc Bonferroni test: *p < 0.05, **p < 0.01 and ***p < 0.001 when compared to control; $p < 0.05 and ##p < 0.01 when comparisons were done as indicated. See also Figure S2.

