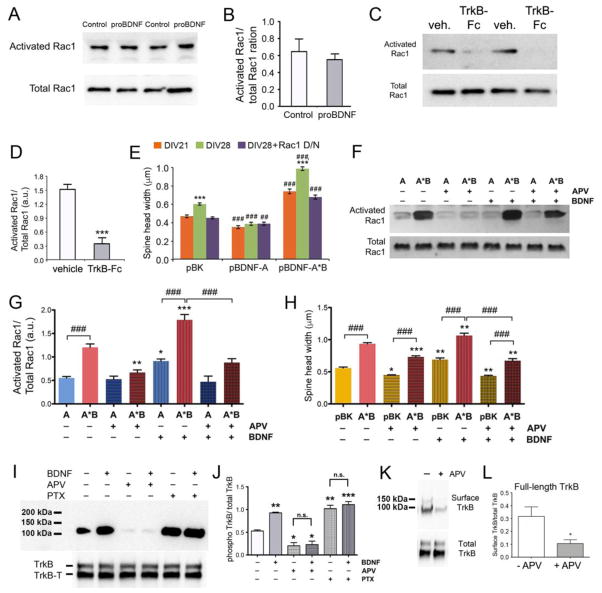
Figure 7. Dendritically synthesized BDNF promotes spine maturation by activating Rac1 through TrkB.
(A and B) Representative images and quantification of Rac1 Western blots of cell lysates from non-infected neurons (control) or neurons infected with AAV-BDNFAAA-A*B (proBDNF) at DIV35 (n=4 samples/condition). Student’s t test: p > 0.05.
(C and D) Representative images and quantification of Western blots of activated Rac1 and total Rac1 in cell lysates from DIV35 neurons treated with either vehicle or TrkB-Fc (2.5 μg/ml) from DIV33 to DIV35 (n=4 samples/condition). Student’s t-test: ***p < 0.001.
(E) Average spine head width of neurons transfected at DIV7 with pBK, pBDNF-A or pBDNF-A*B in combination with either empty vector control or a Rac1 dominant/negative construct (Rac1 D/N). Two-way ANOVA with post-hoc Bonferroni test (n=10 neurons/condition): ***p < 0.001 when compared to DIV21 neurons transfected with the same constructs; ###p < 0.001 when compared to pBK-transfected neurons at the same time point.
(F and G) Representative images and quantification of Rac1 Western blots of cell lysates from DIV35 neurons infected with either AAV-BDNF-A (A) or AAV-BDNF-A*B (A*B), and treated with either vehicle, 50 μM APV, 100 ng/ml BDNF, or both APV and BDNF for 48 hours (n=3 samples/condition). One-way ANOVA with post-hoc Bonferroni test: *p < 0.05, **p < 0.01 and ***p < 0.001 when compared to the non-treated control neurons overexpressing the same Bdnf mRNA; ###p < 0.001 when indicated groups are compared.
(H) Average spine head width of neurons transfected at DIV7 with pBK or pBDNF-A*B and treated with either vehicle, 50 μM APV, 100 ng/ml BDNF, or both APV and BDNF from DIV26 to DIV28. One-way ANOVA with post-hoc Bonferroni test (n=10 neurons/condition): *p < 0.05, **p < 0.01 and ***p < 0.001 when compared to the non-treated control neurons transfected with the same constructs; ###p < 0.001 when indicated groups are compared.
(I) Western blot analyses of phosphorylated TrkB (p-TrkB), total full length TrkB (TrkB), and total truncated TrkB (TrkB-T) in lysates from cultured DIV33-35 neurons treated with BDNF, APV, and/or PTX.
(J) Quantification of p-TrkB and total TrkB levels from Western blots represented in panel I. One-way ANOVA with post-hoc Bonferroni test (n=3): *p < 0.05, **p < 0.01 and ***p < 0.001 when compared to the non-treated control neurons.
(K) Western blot analysis of surface TrkB and total TrkB in lysates from cultured DIV33-35 neurons treated with APV. Surface TrkB was labeled with biotin and pull-downed with streptavidin agarose beads.
(L) Quantification of surface full-length TrkB/total TrkB ratios from Western blots represented in panel K (n=4). *p < 0.05 by Student’s t test.
Data are reported as mean ± SEM. See also Figure S7.

