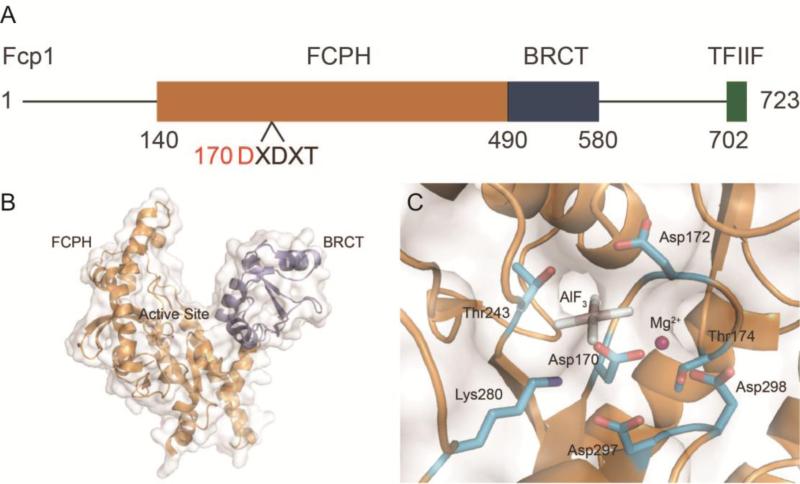
Figure 3.
Structure and organization of Fcp1 from Saccharomyces pombe. A) Domain diagram of Fcp1 with FCPH domain (orange), BRCT domain (blue), and TFIIF interacting region (green). The Fcp/Scp signature motif is labeled with the nucleophile Asp170 highlighted (red). B) Structural view of Fcp1 with domains colored as in panel A and active site labeled (PDB ID: 3EFO). The TFIIF interacting domain was not present in the solution of Fcp1. C) View of the Fcp1 active site with binding pocket residues, catalytic magnesium (pink), and AlF3 mimicking the target phosphate (PDB ID: 3EFO).

