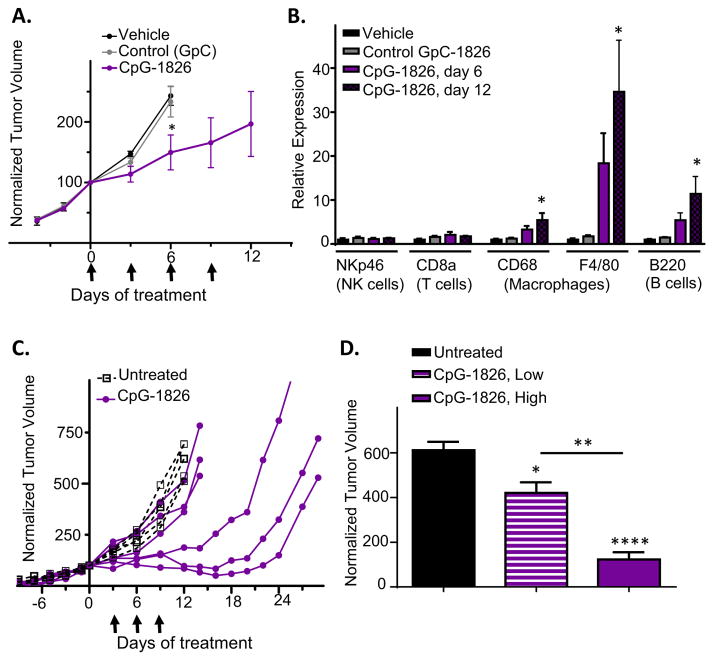
Fig. 1.
CpG-1826 elicits tumor growth delay and immune activation in GL261 gliomas. (A) Shown are GL261 tumor volumes normalized to 100% on the first day of treatment with CpG-1826 or controls (t = 0 days), mean ± SE, for n mice per group: vehicle and GpC controls, n = 4; CpG-1826, n = 9 until day 6, n = 5 until day 9, n = 4 until day 12. *, p < 0.05 for CpG-1826 versus controls on day 6 (one-tailed t-test). Arrows: days of treatment with CpG-1826 or controls. (B) qPCR analysis of tumor RNA samples isolated from tumors in (A) and collected on treatment day 6 (vehicle, control GpC, and CpG-1826 treatment) or day 12 (CpG-1826 treatment). *p < 0.05, n = 4 mice per group. (C) Tumor growth curves in individual mice showing variable responses to CpG-1826 given on days 3, 6, and 9 (arrows). (D) Normalized tumor volumes on CpG-1826 treatment day 12 for CpG-1826 low-responsive mice (“CpG-1826, Low”) versus CpG-1826 high-responsive mice (“CpG-1826, High”), from panel C, with significance by one-way ANOVA with Tukey’s post-test comparing CpG-1826-treated to untreated mice, and low-responsive versus high-responsive mice, as indicated.

