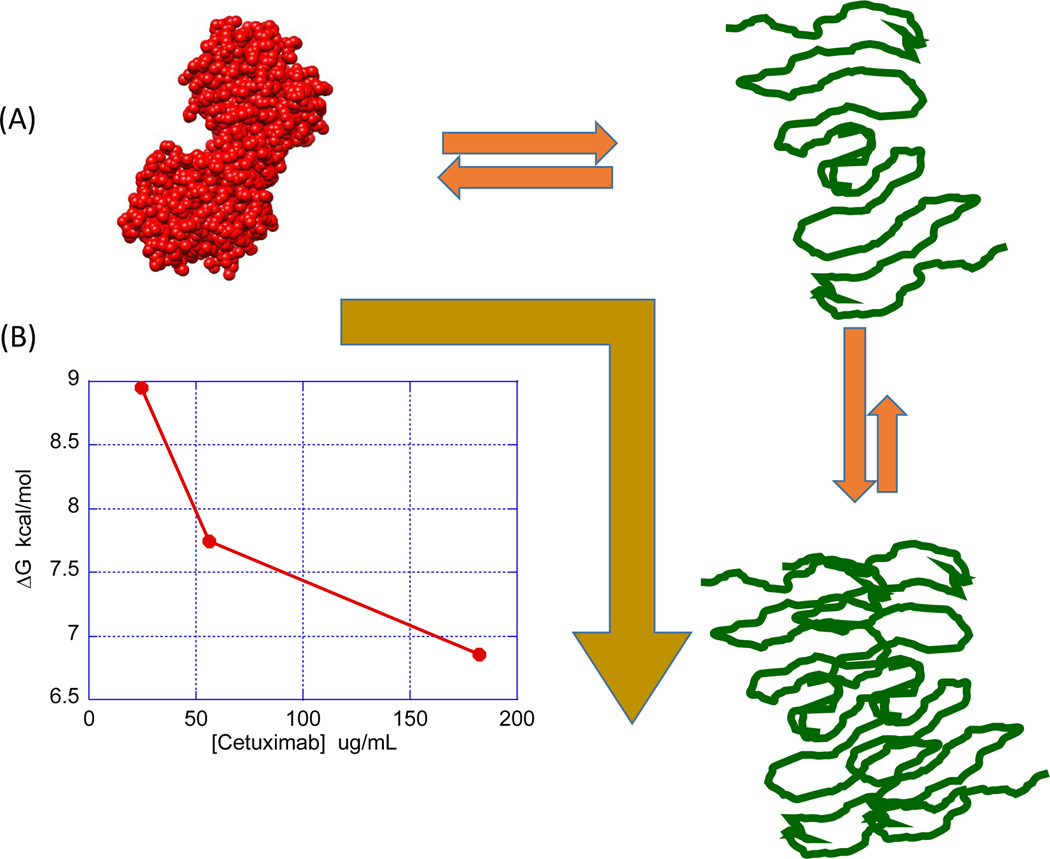
Figure 6.
Denatured state aggregation will pull the equilibrium to the right and decrease ΔG as the protein concentration increases (A). The gold arrow indicates that the equilibrium is shifted towards the denatured state. The decrease in ΔG indicates a lower stability of the native state. (B) Illustrates this situation by depicting the concentration dependence of ΔG for cetuximab in urea denaturation experiments. Chemical denaturation experiments were performed using a linear gradient of urea from 0 M to 9 M (The Hunk Automated Protein Denaturation System, Unchained Labs, Norton, MA). The buffer was 10 mM PBS, pH 7.5.

