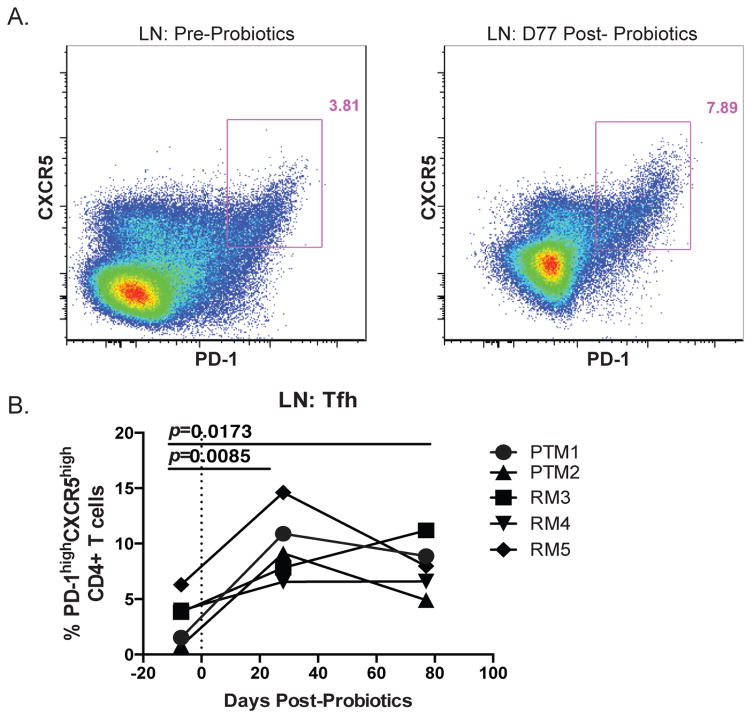
Fig. 3.
Increased frequency of Tfh in the LN post-PBio therapy. (A) Representative staining demonstrating the Tfh population in the LN pre-PBio (left panel) and post-PBio (right panel). Cells were identified by first gating on lymphocytes and excluding doublets using FSC and SSC properties and removing dead cells with an Aqua Live/Dead viability dye. The frequency of Tfh cells within this subset was then determined by gating on CD3+CD4+PD-1hiCXCR5+ cells. (B) Percentage of Tfh in the LN at all time points. Each animal is represented by a different symbol (n=5). Each experiment was performed once per animal per time-point. Statistical significance between the two post-PBio time-points (d28 or d77/80) and the pre-PBio time-point (d−7) was calculated using a paired t test.

