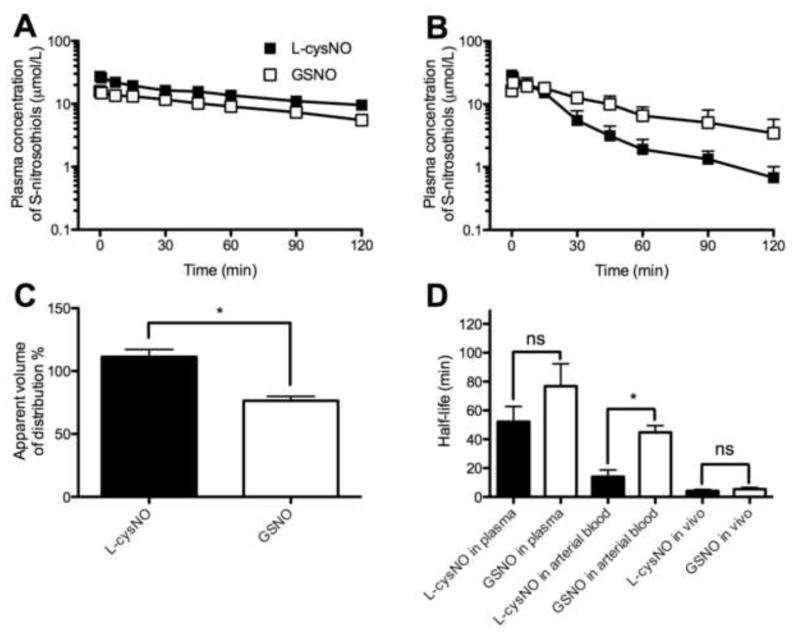
Figure 5.
Pharmacokinetics of L-cysNO and GSNO presented as plasma concentration of total S-nitrosothiols (n=5 except for n=3 for L-cysNO in vivo). (A) L-cysNO and GSNO added to plasma in vitro. (B) L-cysNO and GSNO added to whole arterial blood in vitro. (C) Apparent volume of distribution of L-cysNO and GSNO 40 s after their addition to whole blood in vitro (normalized to concentrations measured after equimolar addition to PBS). The calculated apparent volume of distribution was compared to the plasma volume (~70%) of sheep whole blood. (D) Half-life of L-cysNO and GSNO after addition to plasma and whole blood in vitro, and intra-arterial infusion in vivo. *p<0.05 L-cysNO versus GSNO.

