Figure 1.

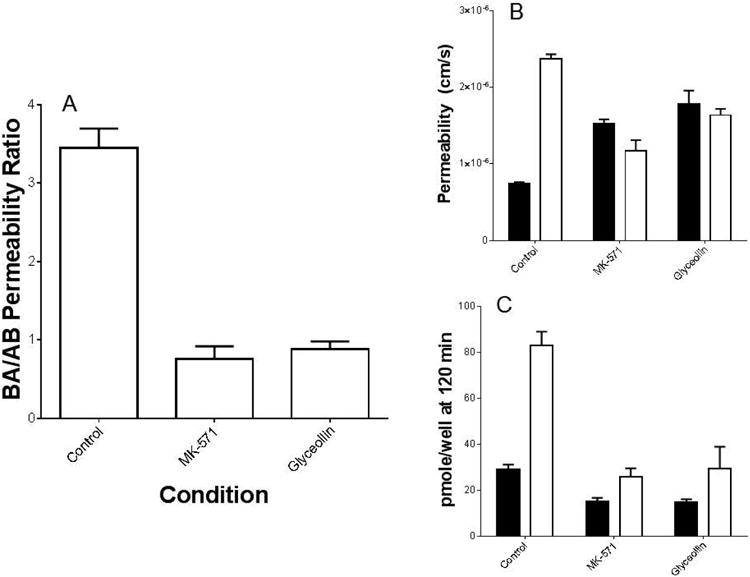
CDF permeability in Caco-2 cells grown on Transwell® filters. (A) Average ratios of CDF permeability in the Basolateral-to-Apical (BA) direction relative to that in the Apical-to-Basolateral (AB) direction. Each value represents the average of multiple experiments (n = 7 for control “no inhibitor” and n = 3 for each compound) with there being 3 filters in each transport direction per experiment. MK-571 and glyceollin ratios were significantly reduced relative to the control (p < 0.05), and were not different from one another. (B) Mean CDF permeability results in the absence (control) vs. presence of MK-571 or glyceollin, and (C) mean pmole CDF remaining in cells at 120 minutes. Open bars represent transport in the AB direction, and closed bars in the BA direction. For both (B) and (C), MK-571 and glyceollin results were significantly different from the corresponding control/transport direction (p < 0.05). MK-571 and glyceollin concentration was 100 μM.
