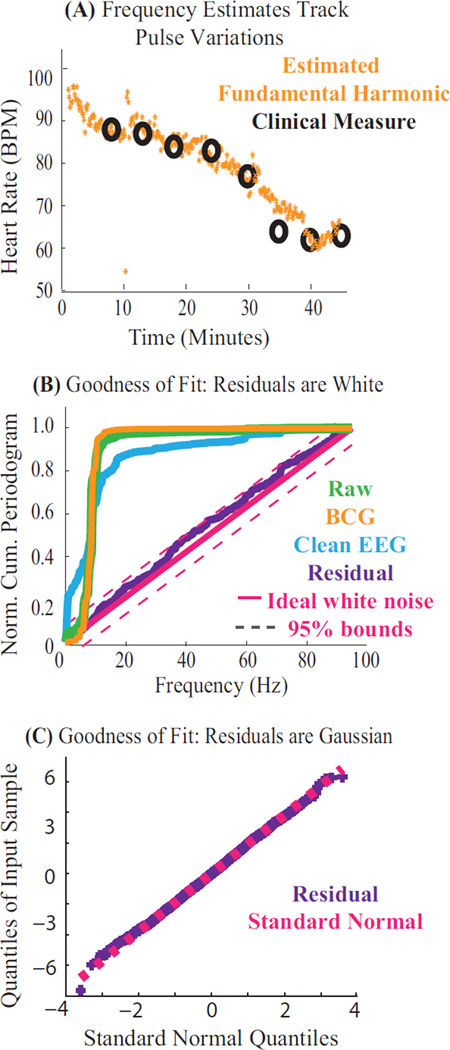
Figure 3. Parameter Estimates are Accurate and Model Explains the Data.
Results from harmonic regression applied to EEG recorded at 3 T. (A) Estimated fundamental frequency ω̂ over a period of drug-induced changes in heart rate. The algorithm yields accurate, high resolution estimates of the fundamental frequency (orange), that match pulse oximeter measurements (black). (B–C) Goodness of fit results on residuals ε̂ (purple), shown for a typical 3 second data segment. (B) Normalized cumulative periodograms (NCP) showing spectral structure for each model component: NCP of 0.2 at 10 Hz indicates 20% of the power lies below 10 Hz. The residual series is within 95% whiteness bounds (magenta). (C) Quantile-Quantile plot of residual series confirms modeled Gaussianity.

