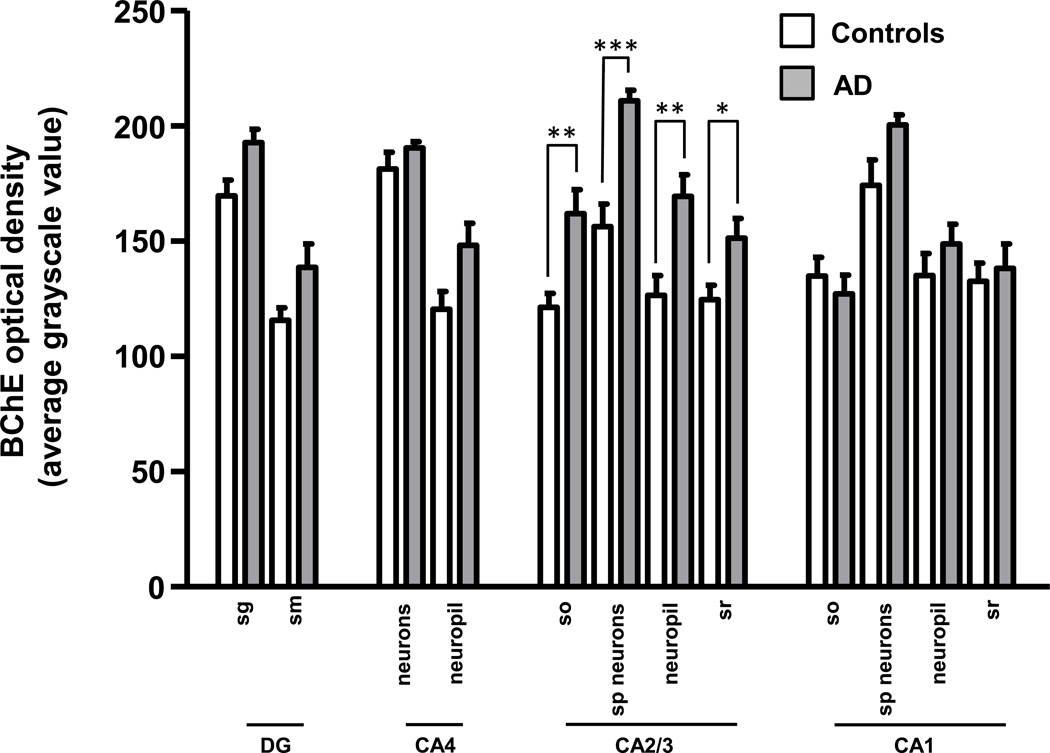
Figure 3.
Bar graph illustrating optical density measurements of BChE immunoreactivity in the hippocampus of Braak stage I–II control (empty bars) and Braak stage V–VI AD (solid bars) cases. Abbreviations: DG, dentate gyrus; SG, stratum granulosum; SM, stratum moleculare; SO, stratum oriens; SP, stratum pyramidale; SR, stratum radiatum. *p < 0.05; **p < 0.01; ***p < 0.001 (Mann-Whitney U).

