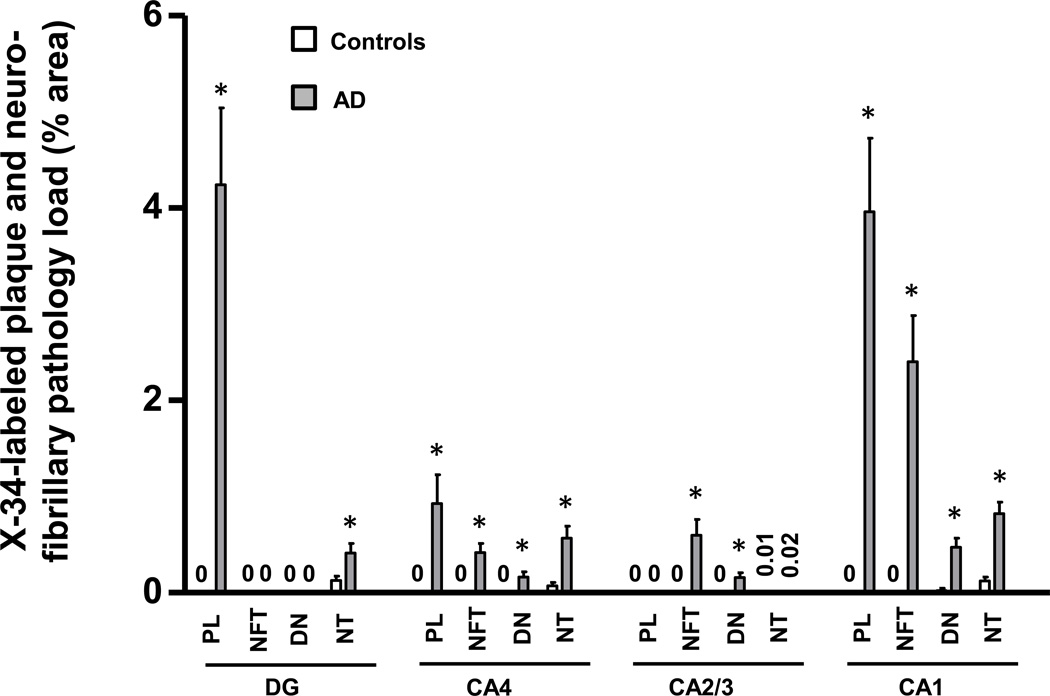
Figure 7.
Bar graph illustrating plaque and neurofibrillary pathology quantified by measuring percent area occupied by X-34-labeled structures in hippocampal fields of controls (empty bars) and AD (solid bars). Abbreviations: DG, dentate gyrus; NFT, neurofibrillary tangles; DN, dystrophic neurites; NT, neuropil threads, PL, plaque load. *p < 0.05.

