Abstract
AIM: To clone novel gastric cancer-associated genes and investigate their roles in gastric cancer occurrence.
METHODS: A method called differential display was used which allows the identification of differentially expressed genes by using PAGE to display PCR-amplified cDNA fragments between gastric cancer cells and normal gastric mucosa cells. These fragments were cloned into plasmid vector pUC18. Homology analysis was made after sequencing these fragments.
RESULTS: Two novel genes were identified compared with sequences from GenBank. One was registered with the AD number AF 051783. In situ hybridization showed that these two novel genes expressed specifically in gastric cancer tissues.
CONCLUSION: The two novel genes obtained by differential display were confirmed to be gastric cancer-associated genes using in situ hybridization.
Keywords: stomach neoplasms; gene clone; nucleotides sequence analysis; in situ hybridization; polymerase chain reaction; RNA, messenger
INTRODUCTION
Cancer is a disease state caused by multiple genetic alterations, which lead to uncontrolled cell proliferation. The process often involves the activation of cellular protooncogenes and inactivation of tumor-suppressor genes. We used a method called differential display[1] to search for novel gastric cancer associated genes. mRNA from normal gastric mucosa cell line GES and gastric cancer cell line 7901 were compared. The identification and characterization of the two cDNA fragments designated GCC1 and GCC2 expressed exclusively in the gastric cancer cell line 7901 are reported below. These sequences have been included into the database in GenBank.
MATERIALS AND METHODS
Cells
Gastric cancer cell line SGC7901 and normal gastric mucosa cell line GES were routinely grown at 37 °C with 10% CO2 in RPMI 1640 medium (Gibco) supplemented with 4 mM glutamine and 10% fetal bovine serum.
RNA isolation
Total cellular RNA from 1 × 10⁷ SGC7901 and GES cells were extracted by the single-step method for RNA isolation by acid ganidinium-thiocyanate-phenol-chloroform extraction[2]. Poly(A) + RNA was isolated using mRNA Isolation Kit (Promega).
Primer design
According to the primer design principle of differential display[3], 3’-end anchored primers: T12A, T12G and T12C; 5’-end random primers: P1:GCCACCATGC; p2: GCCACCATGA were designed by us and synthesized by Sangon Company.
Differential display[4-7]
Reverse transcription of 0.2 μg mRNA,10 μmol/L T12M (M = G, C, A),1 mmol/L dNTP was carried out using the Reverse Transcription Kit (Promega) according to the manufacturer’s instruction in 20 μL total volume. The mixture was kept warm at 42 °C for 2 h, added with 180 μL TE and boiled for 5 min. PCR was conducted using the RT products as templates. The total volume of 20 μL contained 2 μL RT products, 2 μL dNTP (100 μmol/L), 5 μL H2O, 2 μL 3’-end primer, 2 μL 5’-end primer, 2 μL 10 × Buffer, 4 μL Taq enzyme (0.5 × 10⁶ U/L) and 1 μL [α-32P] labeled dATP (3.7 × 10⁸ Bq/L). Reacting condition: 95 °C, 30 s; 42 °C, 3 min; 72 °C, 30 s; 40 cycles, and finally extended at 72 °C for 10 min. Four µL PCR products were analyzed on a 6% polyacrylamide DNA sequencing gel. Recovery and reamplification of positive fragments from the differential display gel was as described above.
Purification and subcloning of PCR products
Recovered PCR products from 2% agarose gel and purified by PEG8000 (Sigma), and subcloned into pUC18 which was previously digested by Hinc II. Identification of recombinants were carried out by restriction enzyme digestion. DNA sequencing reaction was performed by a model 373A automated sequencer (Applied Biosystem).
Database searches and homology analysis
Database searches and sequence alignment were done using the FASTA and BLAST search servers at the NCBI.
In situ hybridization
mRNA probes were labeled by digoxigenin (DIG) using DIG-labeling and detection Kit (Boehringer Mannheim Inc). In situ hybridization was done according to the manufacturer’s instructions. Frozen sections were fixed in 4% paraformaldehyde/PBS and then rinsed with PBS, 0.1N HCl and Triton-100PBS in turn. Hybridization buffer contained 120 µg DIG-mRNA probes, 5 × SSPE, 50% formamide, 5 × Denhardts solution, 0.1% SDS and 100 mg/L ssDNA. Prehybridized for 2 h at 42 °C and then added labeled probes into prehybridized solution to hybridize in humid chamber overnight at 42 °C.
RESULTS
Identification and cloning of differential cDNA fragments by display
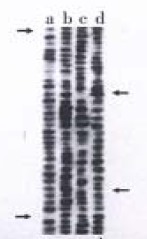
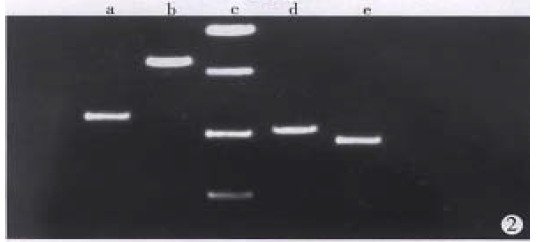
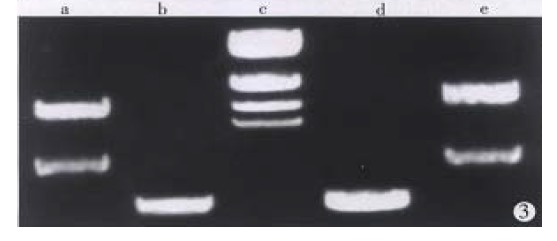
Total RNA of 100 µg was isolated from 107 cells. The ratio of A260/A280 was above 2.0, which indicated good quality of RNA. Four cDNA fragments that appeared to be differentially expressed in SGC7901 cells were identified (Figure 1). These fragments were not detected in normal gastric mucosa cells. Positive results were observed after reamplification of these cDNA fragments (Figure 2). Identification was conducted by restriction enzyme digestion after subcloning these fragments into pUC18 vector. Pst-Iand Kpn I were used to identify recombinants . Two fragments, 500 bp (GCC1) and 800 bp (GCC2), were obtained (Figure 3). Sequence analysis of these two fragments revealed that GCC1 had 80% homology to protein tyrosine kinase encoding gene, while GCC2 had 30% homology to leukemia virus encoding gene. Nucleotides were partly shown as follows:
Figure 1.

6% polyacrylamide DNA sequencing gel with DDPCR. a, c. GES cells; b, d. 7901 cells.
Figure 2.

Electrophoresis results of reamplification of differential display cDNA fragments. a. fragment 1, b. fragment 2, c. PCR marker, d. fragment 3, e. fragment 4.
Figure 3.

Electrophoresis result for GCC1 and GCC2. a. pUC GCC2 cDNA; b. pUC GCC2/Kpn I + Pst I; c. λDNA Marker/Hind III; d. pUC GCC1/Kpn I + Pst I; e. pCU GCC1 cDNA.
GCC1:ATCCTGCTTTGCACATGCAGCGCCCGATG GGCACCAGCCACTCGCCGTCCCCGTTACAGTAGAGCT TGATGGGTACATCCACCTCTTCCGCATTGGCGATGCAG CTGCAGCTGC;GCC2:TAGTCAGCCATGGGGCGGAGAATGGGCGGAACTGGGCGGAGTTACGCGGGGGGGGGATGGGCGGAGTTAGGGGCGGGACTTAATGGTTTGCTGGACTTAATTTTGAGATGGCAT(GenBank: AF051783).
In situ hybridization
Various normal tissues from dead infants were used, including: heart, liver, lung, brain, kidney, bladder, spleen, esophagus, stomach, intestine and colon. Malignant gastric cancer tissues served as control. Positive hybridization signals were mainly distributed in the cytoplasm of gastric cancer tissues. No positive signals were detected in normal tissues mentioned above, indicating the expression specificities of these two genes.
DISCUSSION
One approach to learn about the mechanisms underlying functional or structural changes in cells or tissues is to determine the changes in their pattern or rate of gene expression. Techniques aiming at making an inventory of differentially expressed gene products in two populations of cells being compared often employ (PCR) amplification of all gene products to obtain detectable levels, normally as cDNA fragments. The subsequent identification of these differentially expressed and amplified gene products is generally achieved by one of the two following methods. The differential display method relies on amplification of the entire mRNA populations, followed by a direct comparative display of the resulting populations of cDNA on a sequencing gel to visualize differences in prevalence. Gastric cancer still remains a leading cause of death among all malignant tumors in China. So various mechanisms are involved in cancer. Genetic alterations could be considered as one of the most important one. Multiple genetic alterations can be subgrouped into three groups: (1) the deletion, inactivation or mutation of tumor suppressor genes. For example, p53, the hottest focus in tumor suppress or populations, protects malignant subtype transformation of mutated cells by in itiating programmed cell death. Mutated p53 gene expression was up to 49%-61.5% in gastric cancer tissues by immunohistology[8]. Deletions of other tumor suppressors were often found in gastric cancer, including APC and DCC. (2) The overexpression of oncogenes which plays an important role in tumor occurrence, development and metastasis by encoding growth factors and their related receptors which could promote proliferation of cells. EGF, EGF-R, TGF-α, c-erbB-2, etc, secreted by gastric mucosa cells, were proved to be involved in gastric cancer occurrence. (3) nm23, which is thought to be related to metastasis in gastric cancer[9]. All these genes contribute to the diagnosis and prognosis of gastric cancer, only to some extent. Most of them could be detected at the latest period of malignant gastric cancer. And results often vary among different detecting methods. People can not expect to use them for early diagnosis and treatment. Clone novel gastric cancer-associated genes may provide a clue to clinical treatment. We cloned the novel gastric cancer-associated genes using differential display. Homology analysis indicated that GCC1 was 80% homologue to Trk gene, while GCC2 was 30% homologue to leukemia virus gene. It is well known that Trk plays a significant role in signal transduction, so does leukemia virus in leukemia occurrence. Do these two novel fragments belong to the same families of Trk and leukemia virus What mechanisms of these two fragments are involved in gastric cancer All these questions still need further investigations.
References
- 1.Liang P, Pardee AB. Differential display of eukaryotic messenger RNA by means of the polymerase chain reaction. Science. 1992;257:967–971. doi: 10.1126/science.1354393. [DOI] [PubMed] [Google Scholar]
- 2.Bauer D, Müller H, Reich J, Riedel H, Ahrenkiel V, Warthoe P, Strauss M. Identification of differentially expressed mRNA species by an improved display technique (DDRT-PCR) Nucleic Acids Res. 1993;21:4272–4280. doi: 10.1093/nar/21.18.4272. [DOI] [PMC free article] [PubMed] [Google Scholar]
- 3.Chomczynski P, Sacchi N. Single-step method of RNA isolation by acid guanidinium thiocyanate-phenol-chloroform extraction. Anal Biochem. 1987;162:156–159. doi: 10.1006/abio.1987.9999. [DOI] [PubMed] [Google Scholar]
- 4.Guimarães MJ, Lee F, Zlotnik A, McClanahan T. Differential display by PCR: novel findings and applications. Nucleic Acids Res. 1995;23:1832–1833. doi: 10.1093/nar/23.10.1832. [DOI] [PMC free article] [PubMed] [Google Scholar]
- 5.Shoham NG, Arad T, Rosin-Abersfeld R, Mashiah P, Gazit A, Yaniv A. Differential display assay and analysis. Biotechniques. 1996;20:182–184. doi: 10.2144/96202bm04. [DOI] [PubMed] [Google Scholar]
- 6.Mou L, Miller H, Li J, Wang E, Chalifour L. Improvements to the differential display method for gene analysis. Biochem Biophys Res Commun. 1994;199:564–569. doi: 10.1006/bbrc.1994.1265. [DOI] [PubMed] [Google Scholar]
- 7.Callard D, Lescure B, Mazzolini L. A method for the elimination of false positives generated by the mRNA differential display technique. Biotechniques. 1994;16:1096–107, 1096-107. [PubMed] [Google Scholar]
- 8.Ichiyoshi Y, Oiwa H, Tomisaki S, Sakaguchi Y, Ohno S, Maehara Y, Sugimachi K. Overexpression of p53 is associated with growth pattern and prognosis in advanced gastric cancer. Hepatogastroenterology. 1997;44:546–553. [PubMed] [Google Scholar]
- 9.Ura H, Denno R, Hirata K. Correlation between nm23 protein and several cell adhesion molecules in human gastric carcinoma. Jpn J Cancer Res. 1996;87:512–517. doi: 10.1111/j.1349-7006.1996.tb00253.x. [DOI] [PMC free article] [PubMed] [Google Scholar]


