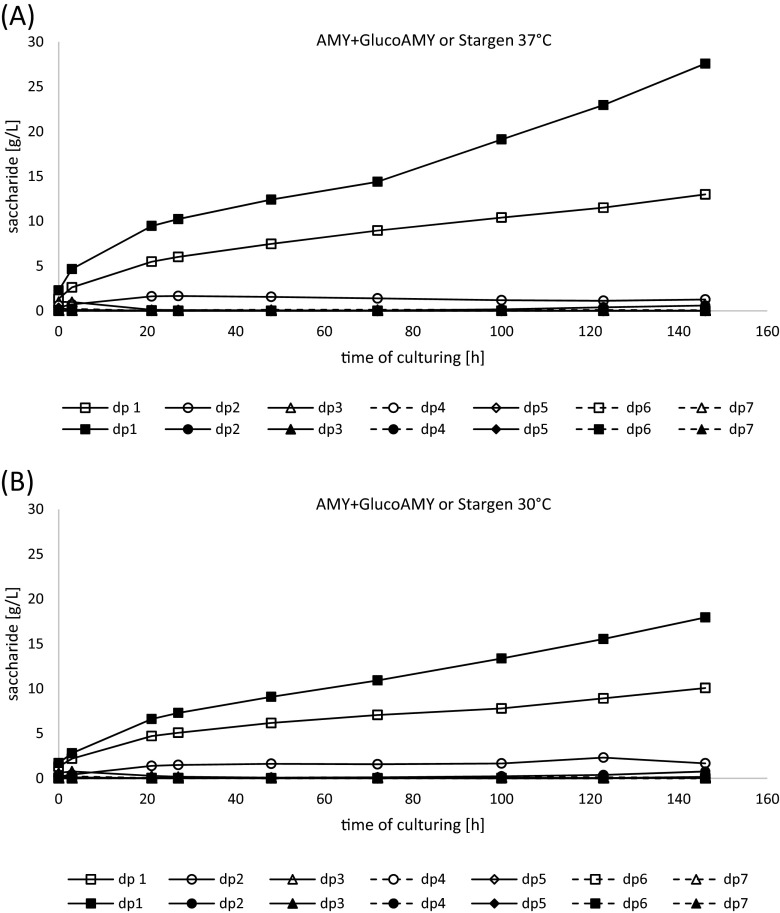
Fig. 4.
(Oligo)saccharide composition profile generated during SSF process with raw starch treated with either AMY + GlucoAMY (open symbols) or Stargen (closed symbols) preparations at 37 °C (a) or 30 °C (b). The profiles were determined in the control cultures without yeast cells provision. Additional blank cultures, containing neither yeast cells nor enzymatic preparations, were conducted to assess the extent of spontaneous decomposition of raw starch—not shown. Y axis: concentration of (oligo)saccharide of polymerization degree of dp1 to dp7 in g/L in the SSF process containing a AMY + GlucoAMY (open symbols) and Stargen (closed symbols) at 37 °C, b AMY + GlucoAMY (open symbols) and Stargen (closed symbols) at 30 °C. X axis: time of the SSF process in h.

