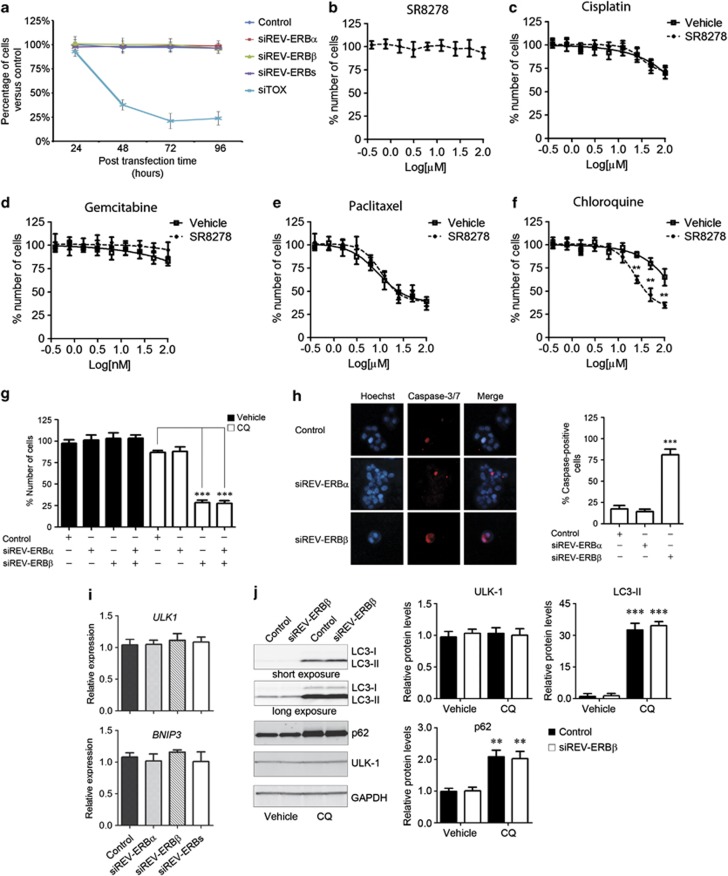
Figure 3.
REV-ERBβ silencing enhances the cytotoxicity of the lysosomotropic autophagy inhibitor chloroquine. (a) BT-474 cells were transfected with pooled siRNA sequences against REV-ERBα (siREV-ERBα), REV-ERBβ (siREV-ERBβ), both REV-ERBα and REV-ERBβ (siREV-ERBs), a non-targeting pool (Control) and a pool of cytotoxic siRNA sequences (siTOX). The percentage of cells versus the Control transfection was evaluated at the indicated post-transfection times. (b) Concentration response plots of REV-ERB antagonist SR8278 cytotoxicity in BT-474 cells after 72 h treatment. Values of cells treated with vehicle were set to 100% of number of cells. Compound concentration is reported as log[μM]. Data expressed as mean±s.e.m., n=6. (c–f) Concentration response plots of Cisplatin (c),Gemcitabine (d), Paclitaxel (Taxol) (e) and Chloroquine (f) cytotoxicity in BT-474 cells in presence (dash line) or absence (solid line) of 10 μM SR8278 for 72 h. Values of cells treated with vehicle were set to 100% of number of cells. Compound concentration is reported as log[μM]. Data expressed as mean±s.e.m., n=6. **P<0.01, SR8278 versus vehicle. (g) BT-474 cells were reverse transfected with pooled siRNA sequences against REV-ERBα (siREV-ERBα), REV-ERBβ (siREV-ERBβ) and both REV-ERBα and REV-ERBβ genes or a non-targeting pool as a negative control (Control). One day post transfection, cells were treated with vehicle or chloroquine (CQ) for 48 h and the relative number of cells was evaluated by CyQUANT assay. Results are shown as mean±s.e.m. of the percentage number of cells normalized setting a control sample to 100%. ***P<0.001 CQ-treated siREV-ERBβ, and siREV-ERBα plus siREV-ERBβ versus Control samples. (h) Caspase-3 and -7 induction in BT-474 cells treated as in g was evaluated with the fluorescent SR-DEVD-FMK compound (Invitrogen). Hoechst 33342 (Hoechst) was used to stain cell nuclei. Count of the percentage of caspase-positive cells is given at the right. Shown as mean±s.e.m., n=3. ***P<0.001, siREV-ERBβ versus control. (i) The expression of the autophagy-related genes ULK-1 and BNIP3 was analyzed in BT-474 cells 72 h after transfection with pooled siRNA sequences against REV-ERBα (siREV-ERBα), REV-ERBβ (siREV-ERBβ) and both REV-ERBα and REV-ERBβ (siREV-ERBs), with a non-targeting pool as a negative control (Control). Relative expression was determined by quantitative reverse transcriptase–PCR using GAPDH for normalization. Data are shown as mean±s.e.m., n=3. (j) BT-474 cells were transfected with pooled siRNA sequences against REV-ERBβ (siREV-ERBβ) or a non-targeting pool as a negative control (Control) and then treated with Vehicle (water) or 50 μM CQ. The levels of LC3, p62, ULK-1 and GAPDH proteins were analyzed by Immunoblot analysis with specific antibodies. Densitometry analysis of protein signals is reported as relative protein levels normalized by GAPDH. Vehicle-treated Control sample value was set to 1. Shown as mean±s.e.m., n=3. **P<0.01 and ***P<0.001, CQ versus vehicle.

