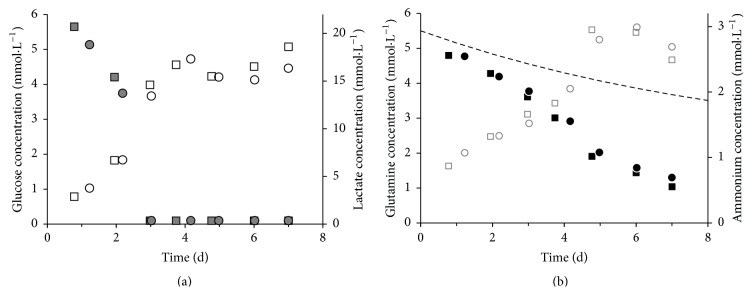
Figure 2.
Metabolite profile of hUC MSCs from two different donors (HUC #255, female: squares, HUC #256, male: circles) in static 12-well culture plate in 1 mL DMEM LG medium with seeding density of 8000 cells·cm−2. (a) Grey full—glucose, white—lactate; (b) black—glutamine, grey empty—ammonium; dotted line: glutamine thermal decay.

