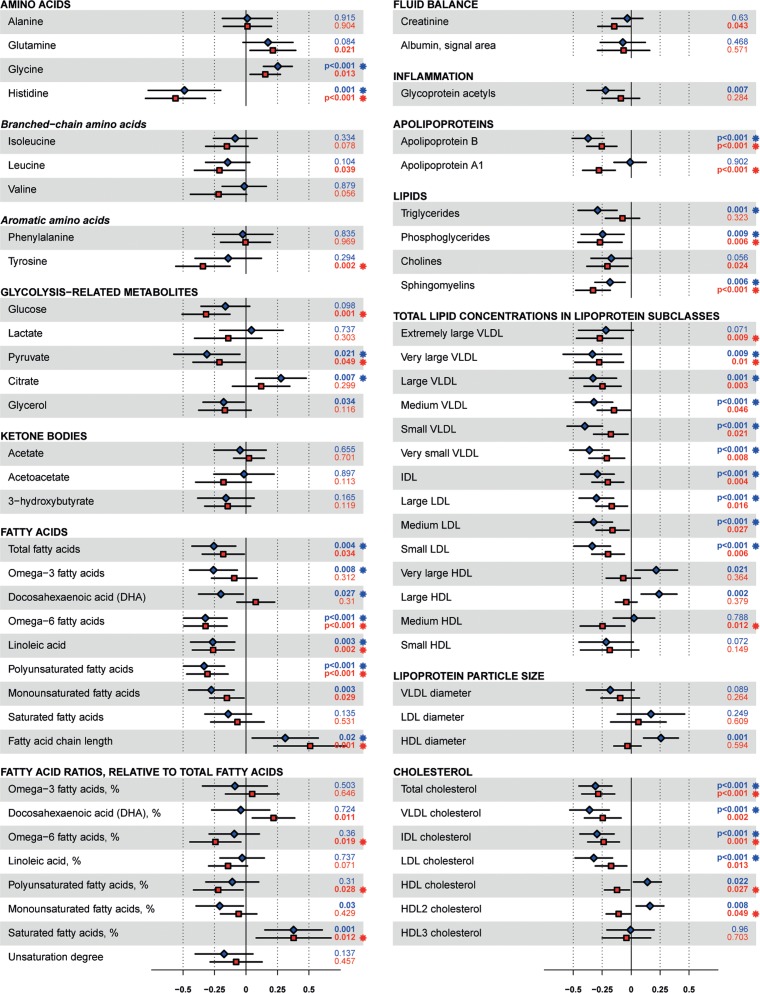
Figure 5.
Effects of the intervention on 1H-NMR metabolites. Effect sizes are per 1-SD log-transformed metabolite concentration and adjusted for age and gender. Squares indicate mean and error bars denote 95% confidence intervals. Blue squares indicate males, red squares indicate females. Individuals using lipid-lowering agents were removed before analysing fatty acids, fatty acids ratios, apolipoproteins, lipids, total lipid concentrations in lipoprotein subclasses, lipoprotein particle size and cholesterol. VLDL, very low density lipoprotein; IDL, intermediate density lipoprotein; LDL, low density lipoprotein; HDL, high density lipoprotein.

