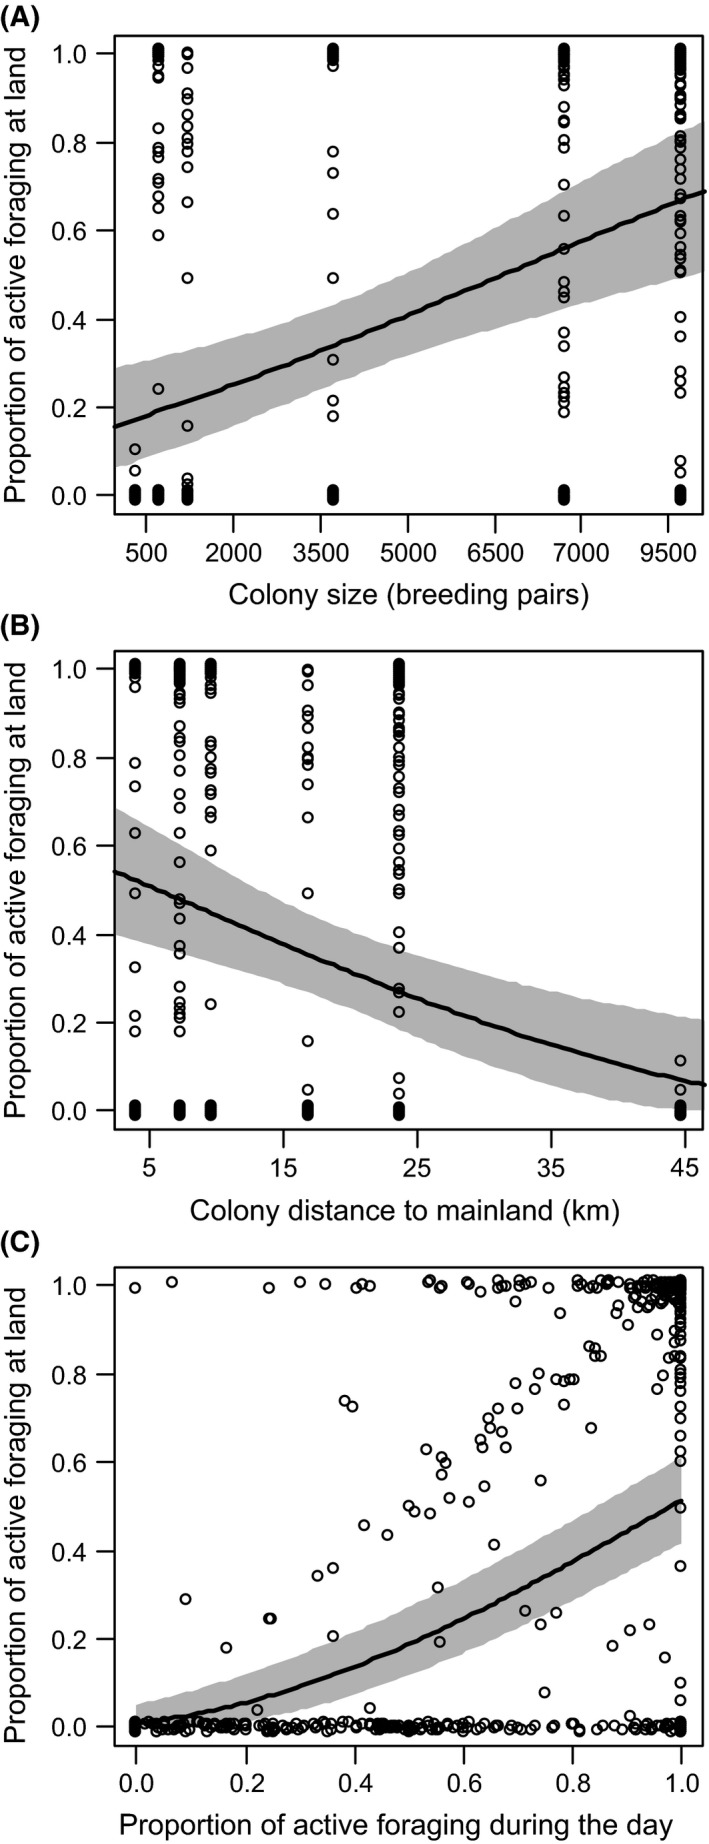
Figure 4.

Proportion of active foraging at land/sea in relation to (A) colony size (estimated mean (95% CrI), 0.21 (0.07–0.36)); (B) distance of colony from the mainland (−0.18 (−0.33 to −0.03)); and (C) proportion of active foraging during the day/night (0.70 (0.58–0.80)) of all tracked Larus fuscus (n = 79). Residual SD was 0.50 (0.48–0.53), between‐colony SD was 0.12 (0.06–0.19), and between‐bird was SD 0.31 (0.27–0.35). Circles represent raw data, bold line represents predicted value for the population, and the symmetric 95% CrI is given in gray. When excluding birds from Helgoland, the effect of distance of colony from the mainland on terrestrial foraging disappears (Table S6).
