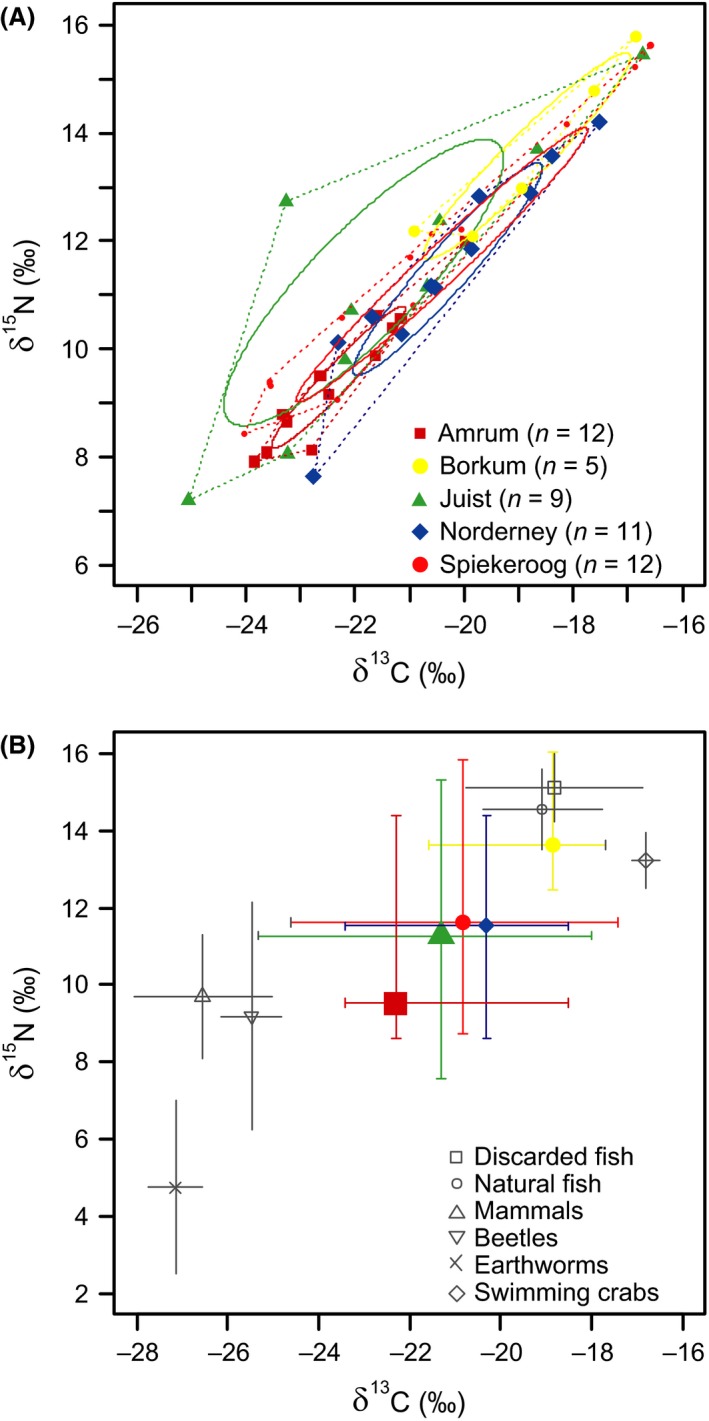
Figure 6.

(A) Standard ellipse areas corrected for small sample sizes (SEAc, 40% credible interval) following Jackson et al. (2011) based on stable isotope values (δ 13C and δ 15N) in red blood cells and (B) colony‐specific isotopic values (mean ± SD) of Larus fuscus (n = 49) from different breeding colonies during the incubation periods from 2010 to 2013. Dotted lines indicate the layman metric of the convex hull area (TA). Different colors indicate different breeding colonies including all study years.
