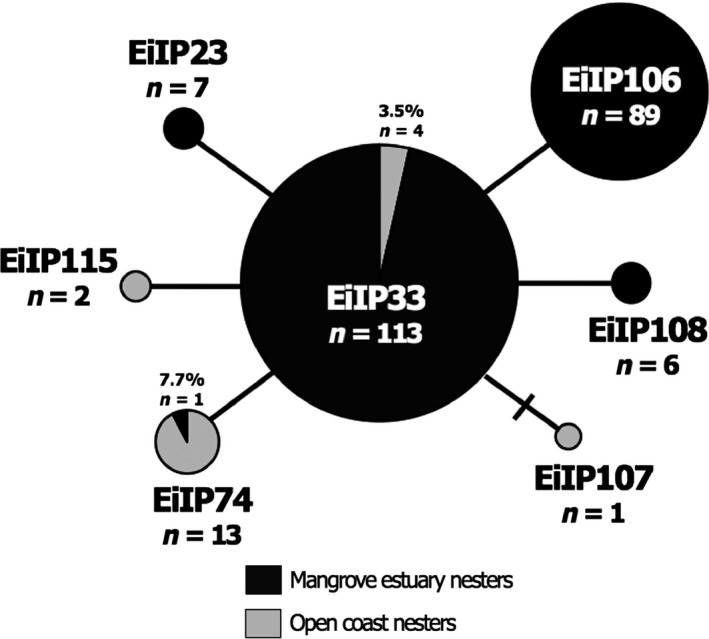
Figure 3.

Haplotype network of hawksbills nesting in mangrove estuaries (black) and along open‐coast beaches (gray). The size of the nodes represents the relative frequency of the haplotypes out of the total sample. Vertical and horizontal bars represent one extra mutational step connecting two haplotypes. This haplotype network is specific to samples collected from Central American rookeries, but with the exception of sample size, is representative of all rookeries included in this study.
