
FIGURE 10.
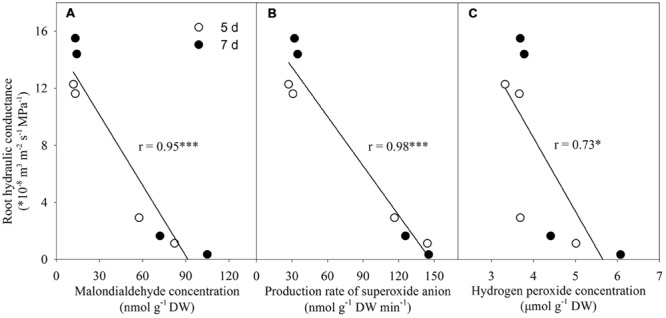
Correlations between root hydraulic conductance and both malondialdehyde and reactive oxygen species levels. ∗P < 0.05, ∗∗∗P < 0.001. Pearson correlation analysis was conducted using SPSS software (SPSS Inc. 16.0). (A) Correlation between root hydraulic conductance and malondialdehyde concentration; (B) Correlation between root hydraulic conductance and production rate of superoxide anion; (C) Correlation between root hydraulic conductance and hydrogen peroxide concentration.