
FIGURE 8.
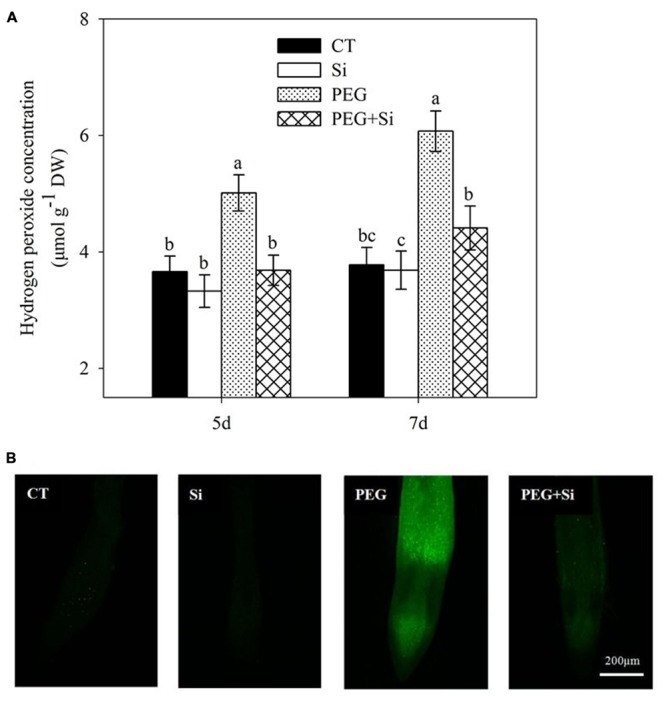
Effects of silicon on hydrogen peroxide (H2O2) levels in the leaves of tomato seedlings grown under water stress. Data are shown as means ± SD (n = 3) for H2O2 level. Bars with the same letters are not significantly different at P < 0.05. The histochemical analysis was conducted 6 days after water stress, and the H2O2 level was monitored using a fluorescent dye 2,7-dichlorofluorescin diacetate. (A) Hydrogen peroxide concentration; (B) Histochemical staining.