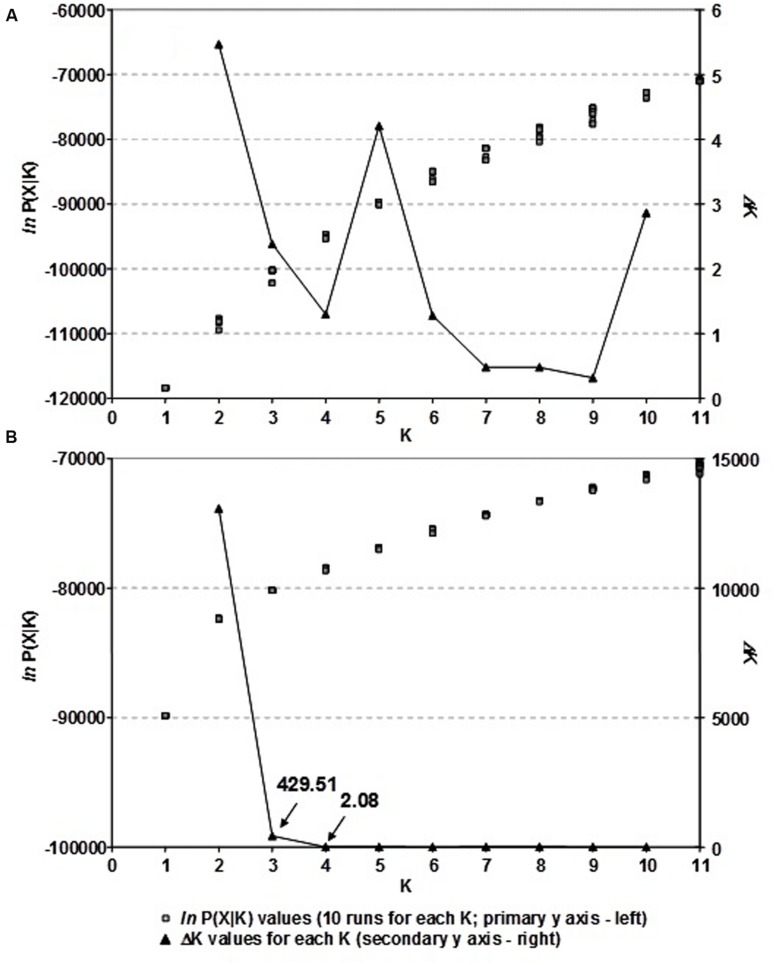
FIGURE 2.
(A) The choice of the most likely number of clusters (K) inferred from 1,229 DArT markers of 89 Croatian wheat cultivars and (B) as inferred from 166 common DArT markers analyzing 523 wheat cultivars from seven European countries using a model-based clustering method of Pritchard et al. (2000): ln P(X| K) values for each of the ten independent runs for each K and ΔK values for each K based on the second order rate of change of the likelihood function with respect to K described by Evanno et al. (2005).

