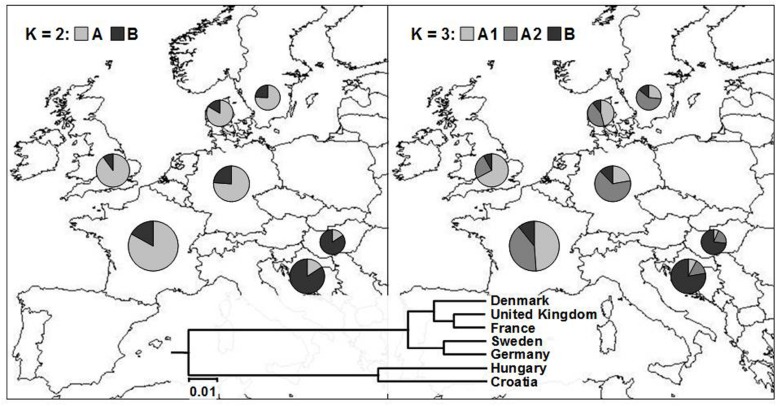
FIGURE 4.
Average proportion of membership of wheat cultivars in each of the seven European countries in each of the two (K = 2; left) and three (K = 3; right) clusters as defined with a model-based clustering method from Pritchard et al. (2000). The UPGMA tree based on inter-country ϕST values is given at the bottom of the figure.

