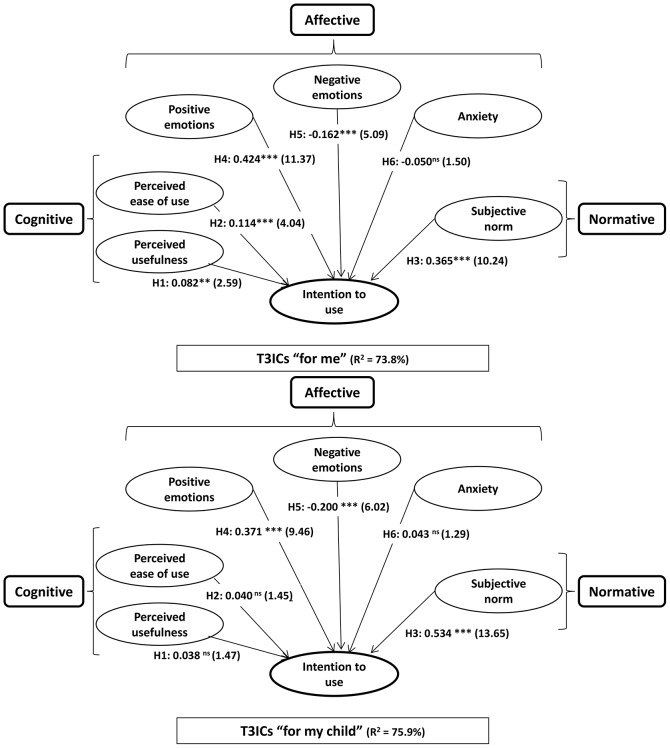
Figure 3.
Sign, magnitude, and significance of the path coefficients, and R2 of T3ICs “for me” and T3ICs “for my child.” *p < 0.05 => t > 1.65; **p < 0.01 => t > 2.33; ***p < 0.001 => t > 3.09; n.s. = not significant [based on t(4.999), one-tailed test]. Please note that the levels of significance (p-values) are either “non significant” or lower than 0.01.

