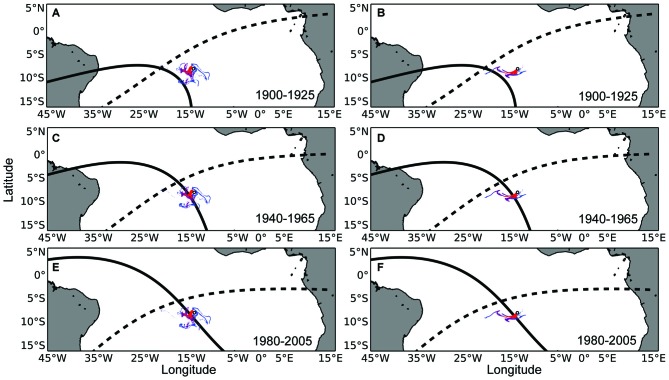
Figure 2.
Maps of waterborne odor plumes in combination with the isolines of magnetic intensity and inclination angle at Ascension Island. (A) The small white circle represents Ascension Island. The intensity (solid black) and inclination angle (dashed black) isolines that existed at Ascension Island in the year 1900 have been plotted in the year 1925, when turtles that left the island in 1900 (as hatchlings) would be expected to return for the first time to mate and nest (as adults). Colored swirls emanating from the island represent the dispersal of waterborne odorant particles within the top 50 m of the ocean surface at the beginning of the nesting season. Red, purple, and blue swirls represent odors that persist in the environment for 15, 30, and 45-day respectively. (B) Same as in (A), but with simulated odorants released towards the end of the nesting season. (C,D) Same as in (A,B), but with magnetic isolines associated with Ascension Island in 1940 plotted 25 years later, in 1965. (E,F) Same as in (A,B), but with magnetic isolines associated with Ascension Island in 1980 plotted 25 years later, in 2005. Hypothetically, a turtle returning to Ascension Island after a 25 year absence might follow the intensity isoline on which it imprinted as a hatchling (Lohmann et al., 2008a; Brothers and Lohmann, 2015) to arrive in the vicinity of the island, where it would then detect olfactory cues which might guide it the rest of the way to the island.

