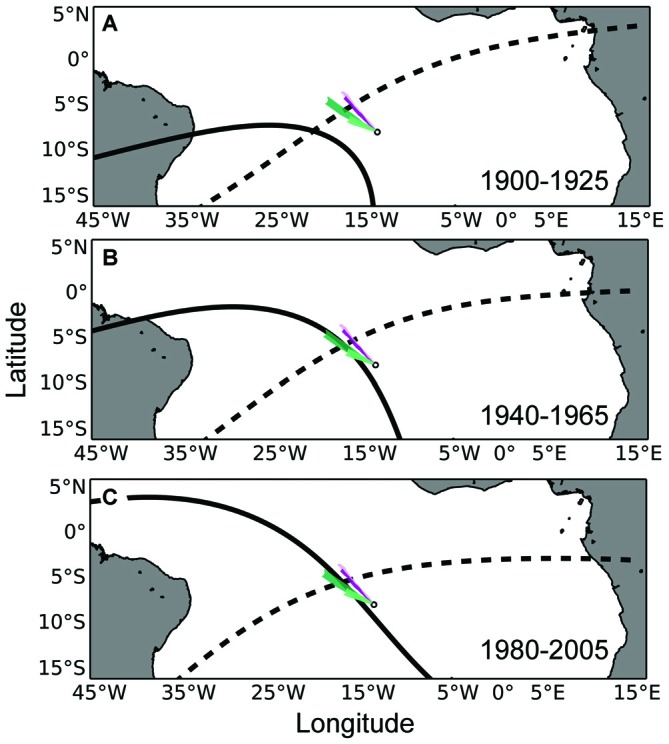
Figure 3.

Maps of airborne odor plumes in combination with the isolines of magnetic intensity and inclination angle at Ascension Island. (A) The small white circle represents Ascension Island. The intensity (solid black) and inclination angle (dashed black) isolines that existed at Ascension Island in the year 1900 have been plotted in the year 1925, when turtles that left the island in 1900 (as hatchlings) would be expected to return for the first time to mate and nest (as adults). Colored plumes emanating from the island represent the dispersal of airborne odorant particles for a duration of 48 h. Purple-colored and green-colored plumes represent simulations toward the beginning and end of the nesting season, respectively (lighter colors indicate simulations from the same year). (B) Same as in (A), but with magnetic isolines associated with Ascension Island in 1940 plotted 25 years later, in 1965. (C) Same as in (A), but with magnetic isolines associated with Ascension Island in 1980 plotted 25 years later, in 2005. Similar to waterborne cues (Figure 2), airborne cues might enlarge the homing target for a turtle initially using the geomagnetic field to return to the vicinity of its natal site.
