Figure 7.

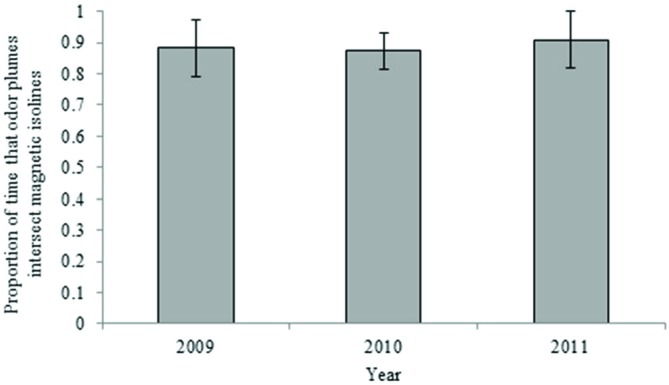
Proportion of time that airborne odor particles intersect the 5-year intensity isoline (yearly averages). Error bars represent 95% confidence intervals.

Proportion of time that airborne odor particles intersect the 5-year intensity isoline (yearly averages). Error bars represent 95% confidence intervals.