Figure 3.


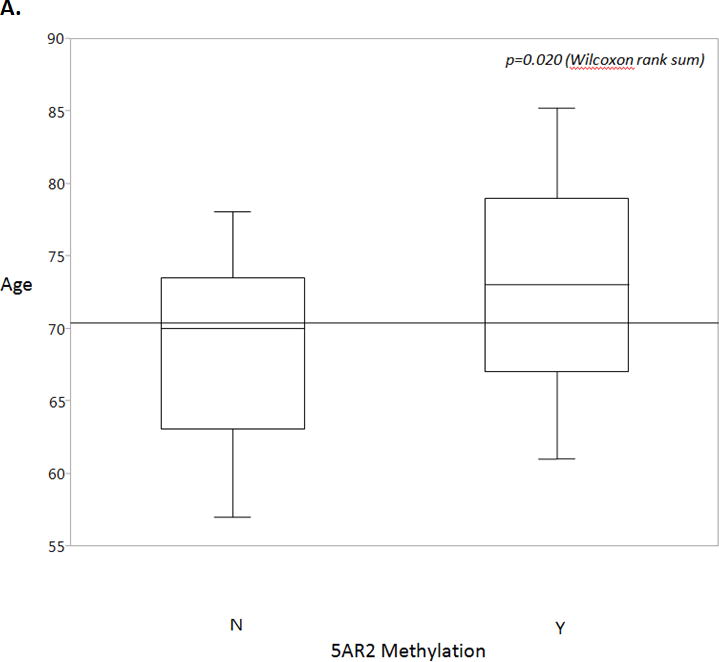
A. Age is a statistically significant predictor of methylation status, with positive methylation status correlating with increased age. Overall mean is shown by the horizontal line. Box plots show 25th to 75th interquartile range and median (horizontal line), whiskers show 10% and 90% quantiles. Wilcoxon rank sum, p=0.020.
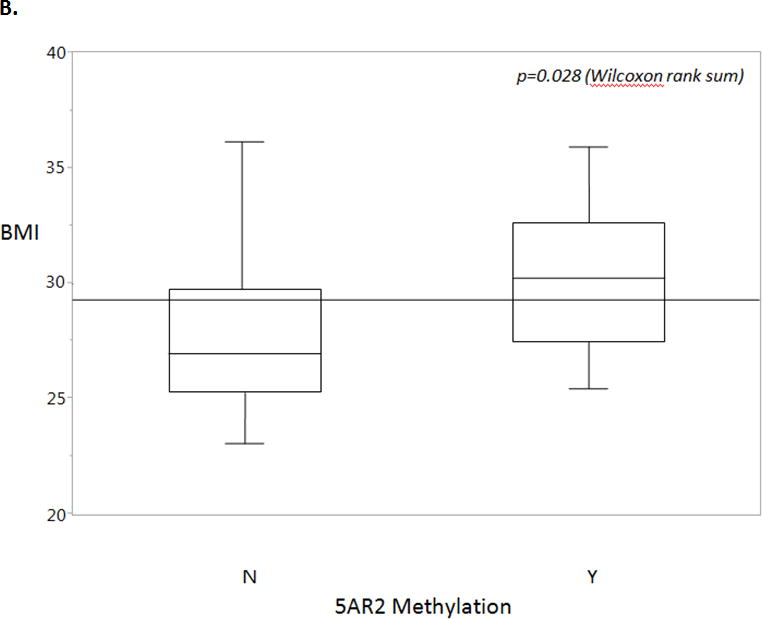
B. Body mass index (BMI) is a statistically significant predictor of methylation status, with positive methylation status correlating with increased BMI. Overall mean is shown by the horizontal line. Box plots show 25th to 75th interquartile range and median (horizontal line), whiskers show 10% and 90% quantiles. Wilcoxon rank sum, p=0.028.
