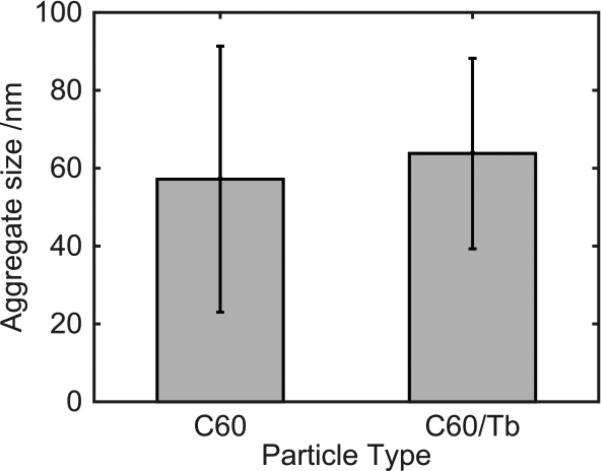
Figure 1.
Characterization of C60 Fullerenes and Terbium-Endohedral Fullerenes. Nanosight analysis of C60 fullerenes and Tb@C60 aggregate size: C60 fullerene aggregates were approximately 55.179 nm with a standard deviation of 34.16 nm. Tb@C60 aggregates were approximately 63.765 nm with a standard deviation of 24.46 nm.

